Puerto Rican vs Immigrants from Sri Lanka Unemployment Among Women with Children Under 6 years
COMPARE
Puerto Rican
Immigrants from Sri Lanka
Unemployment Among Women with Children Under 6 years
Unemployment Among Women with Children Under 6 years Comparison
Puerto Ricans
Immigrants from Sri Lanka
12.5%
UNEMPLOYMENT AMONG WOMEN WITH CHILDREN UNDER 6 YEARS
0.0/ 100
METRIC RATING
335th/ 347
METRIC RANK
6.9%
UNEMPLOYMENT AMONG WOMEN WITH CHILDREN UNDER 6 YEARS
99.8/ 100
METRIC RATING
60th/ 347
METRIC RANK
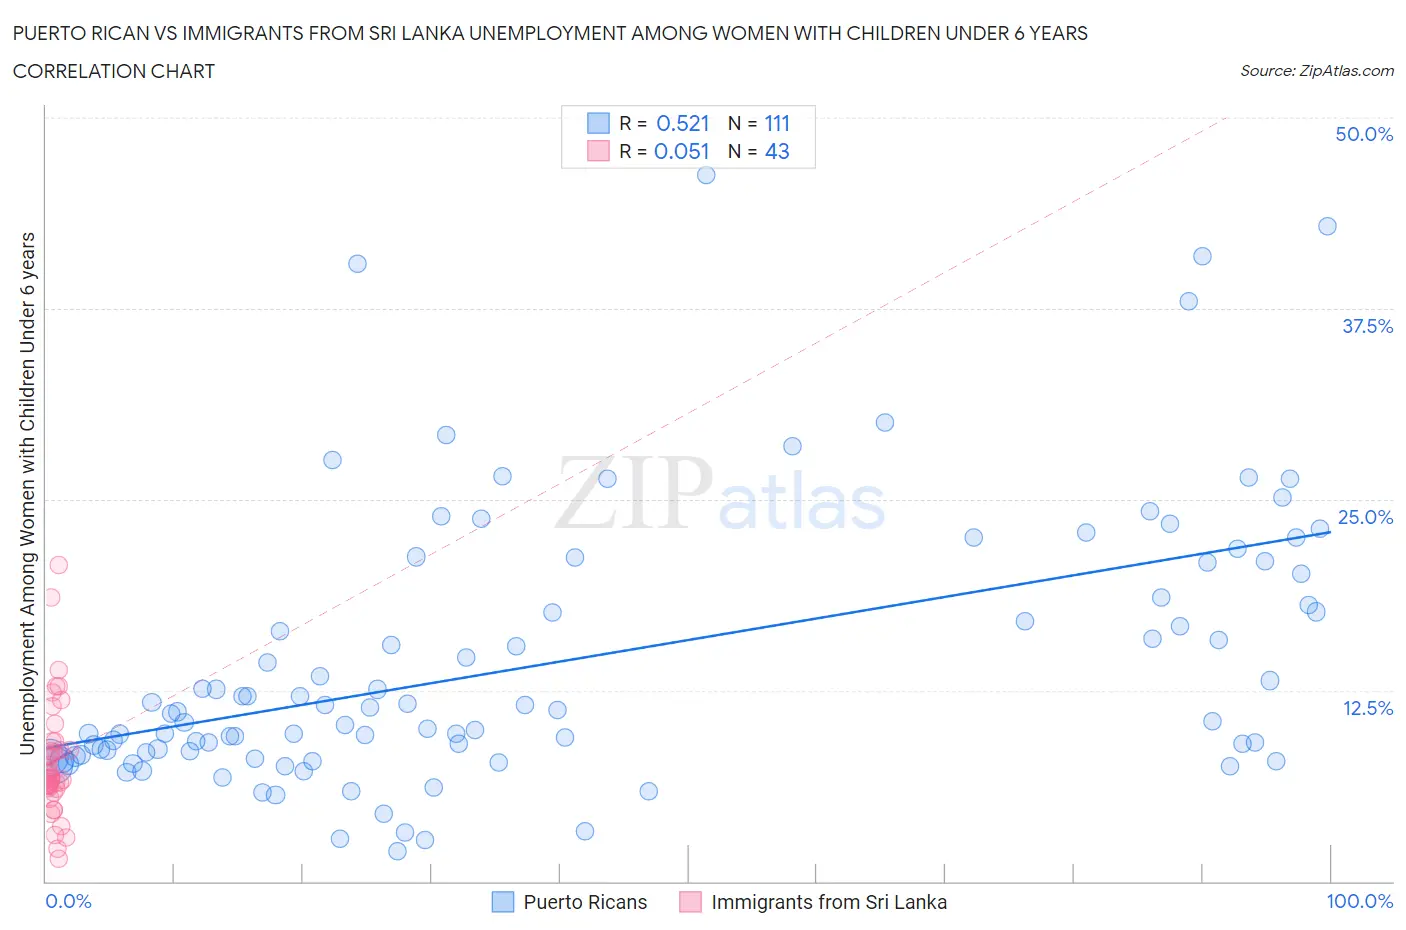
Puerto Rican vs Immigrants from Sri Lanka Unemployment Among Women with Children Under 6 years Correlation Chart
The statistical analysis conducted on geographies consisting of 369,552,119 people shows a substantial positive correlation between the proportion of Puerto Ricans and unemployment rate among women with children under the age of 6 in the United States with a correlation coefficient (R) of 0.521 and weighted average of 12.5%. Similarly, the statistical analysis conducted on geographies consisting of 131,652,229 people shows a slight positive correlation between the proportion of Immigrants from Sri Lanka and unemployment rate among women with children under the age of 6 in the United States with a correlation coefficient (R) of 0.051 and weighted average of 6.9%, a difference of 82.4%.
Unemployment Among Women with Children Under 6 years Correlation Summary
| Measurement | Puerto Rican | Immigrants from Sri Lanka |
| Minimum | 2.0% | 1.5% |
| Maximum | 46.2% | 20.7% |
| Range | 44.2% | 19.2% |
| Mean | 14.4% | 7.9% |
| Median | 11.1% | 6.7% |
| Interquartile 25% (IQ1) | 8.3% | 6.1% |
| Interquartile 75% (IQ3) | 20.1% | 9.2% |
| Interquartile Range (IQR) | 11.9% | 3.1% |
| Standard Deviation (Sample) | 9.0% | 3.9% |
| Standard Deviation (Population) | 9.0% | 3.8% |
Similar Demographics by Unemployment Among Women with Children Under 6 years
Demographics Similar to Puerto Ricans by Unemployment Among Women with Children Under 6 years
In terms of unemployment among women with children under 6 years, the demographic groups most similar to Puerto Ricans are Apache (12.3%, a difference of 1.8%), Shoshone (13.2%, a difference of 5.1%), Chippewa (13.3%, a difference of 6.3%), Pima (13.4%, a difference of 7.1%), and Navajo (13.5%, a difference of 7.5%).
| Demographics | Rating | Rank | Unemployment Among Women with Children Under 6 years |
| Tohono O'odham | 0.0 /100 | #328 | Tragic 10.2% |
| Blacks/African Americans | 0.0 /100 | #329 | Tragic 10.3% |
| Pennsylvania Germans | 0.0 /100 | #330 | Tragic 10.8% |
| Colville | 0.0 /100 | #331 | Tragic 11.2% |
| Sioux | 0.0 /100 | #332 | Tragic 11.5% |
| Natives/Alaskans | 0.0 /100 | #333 | Tragic 11.5% |
| Apache | 0.0 /100 | #334 | Tragic 12.3% |
| Puerto Ricans | 0.0 /100 | #335 | Tragic 12.5% |
| Shoshone | 0.0 /100 | #336 | Tragic 13.2% |
| Chippewa | 0.0 /100 | #337 | Tragic 13.3% |
| Pima | 0.0 /100 | #338 | Tragic 13.4% |
| Navajo | 0.0 /100 | #339 | Tragic 13.5% |
| Immigrants | Yemen | 0.0 /100 | #340 | Tragic 13.5% |
| Lumbee | 0.0 /100 | #341 | Tragic 13.8% |
| Yuman | 0.0 /100 | #342 | Tragic 14.6% |
Demographics Similar to Immigrants from Sri Lanka by Unemployment Among Women with Children Under 6 years
In terms of unemployment among women with children under 6 years, the demographic groups most similar to Immigrants from Sri Lanka are Immigrants from Serbia (6.9%, a difference of 0.080%), Immigrants from Turkey (6.9%, a difference of 0.14%), Icelander (6.9%, a difference of 0.37%), Immigrants from France (6.9%, a difference of 0.37%), and Immigrants from Ethiopia (6.9%, a difference of 0.38%).
| Demographics | Rating | Rank | Unemployment Among Women with Children Under 6 years |
| Chinese | 99.9 /100 | #53 | Exceptional 6.8% |
| Immigrants | Latvia | 99.9 /100 | #54 | Exceptional 6.8% |
| Immigrants | Ukraine | 99.8 /100 | #55 | Exceptional 6.8% |
| Immigrants | Ethiopia | 99.8 /100 | #56 | Exceptional 6.9% |
| Icelanders | 99.8 /100 | #57 | Exceptional 6.9% |
| Immigrants | Turkey | 99.8 /100 | #58 | Exceptional 6.9% |
| Immigrants | Serbia | 99.8 /100 | #59 | Exceptional 6.9% |
| Immigrants | Sri Lanka | 99.8 /100 | #60 | Exceptional 6.9% |
| Immigrants | France | 99.7 /100 | #61 | Exceptional 6.9% |
| Somalis | 99.7 /100 | #62 | Exceptional 6.9% |
| Maltese | 99.7 /100 | #63 | Exceptional 6.9% |
| Tongans | 99.7 /100 | #64 | Exceptional 6.9% |
| Immigrants | Kuwait | 99.7 /100 | #65 | Exceptional 6.9% |
| Immigrants | Belgium | 99.6 /100 | #66 | Exceptional 6.9% |
| Immigrants | Netherlands | 99.5 /100 | #67 | Exceptional 7.0% |