Puerto Rican vs Immigrants from Chile Unemployment Among Ages 65 to 74 years
COMPARE
Puerto Rican
Immigrants from Chile
Unemployment Among Ages 65 to 74 years
Unemployment Among Ages 65 to 74 years Comparison
Puerto Ricans
Immigrants from Chile
6.4%
UNEMPLOYMENT AMONG AGES 65 TO 74 YEARS
0.0/ 100
METRIC RATING
335th/ 347
METRIC RANK
5.3%
UNEMPLOYMENT AMONG AGES 65 TO 74 YEARS
76.0/ 100
METRIC RATING
144th/ 347
METRIC RANK
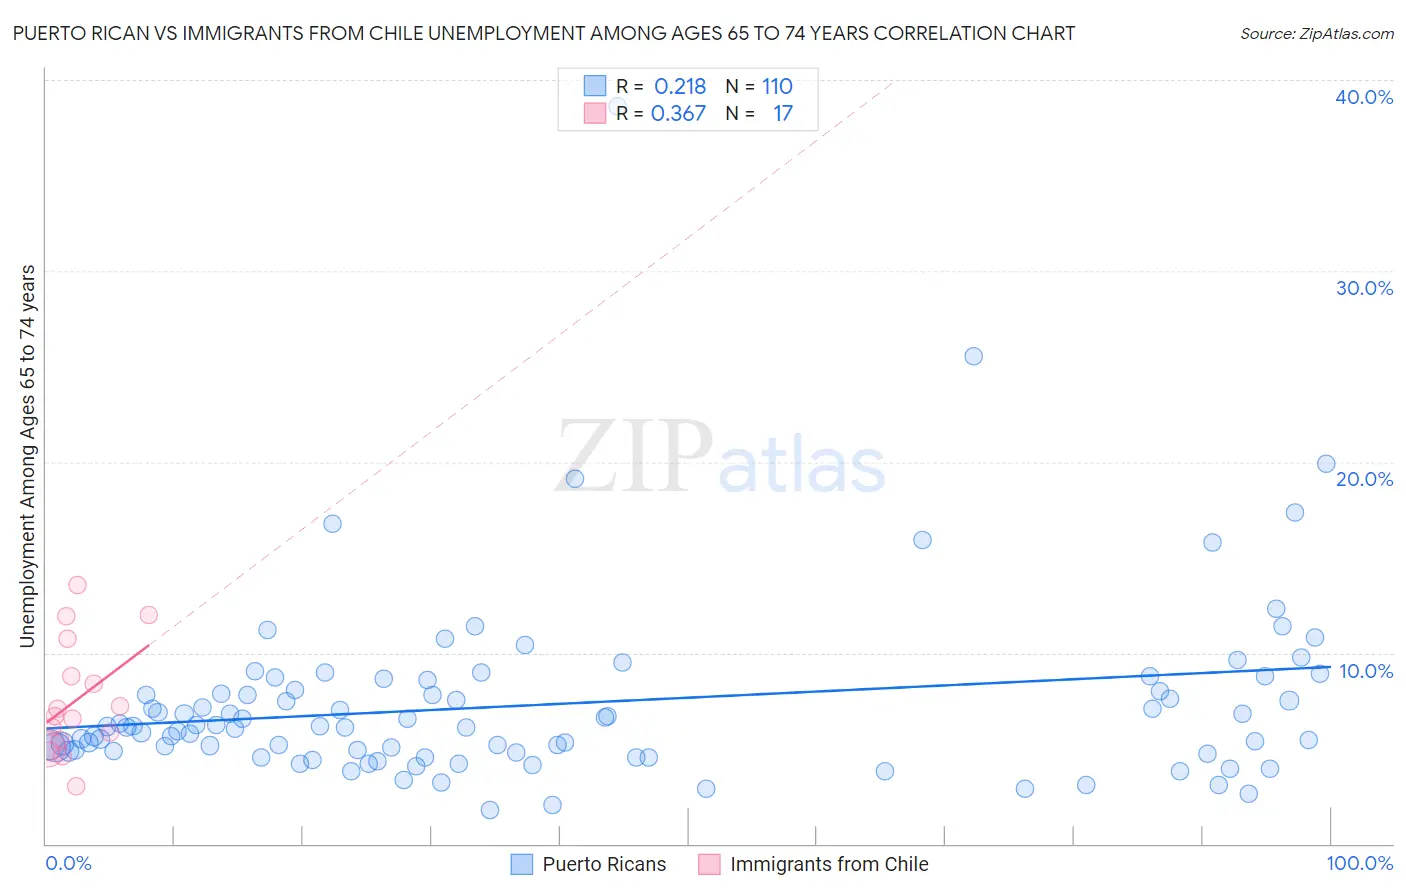
Puerto Rican vs Immigrants from Chile Unemployment Among Ages 65 to 74 years Correlation Chart
The statistical analysis conducted on geographies consisting of 431,991,272 people shows a weak positive correlation between the proportion of Puerto Ricans and unemployment rate among population between the ages 65 and 74 in the United States with a correlation coefficient (R) of 0.218 and weighted average of 6.4%. Similarly, the statistical analysis conducted on geographies consisting of 204,712,388 people shows a mild positive correlation between the proportion of Immigrants from Chile and unemployment rate among population between the ages 65 and 74 in the United States with a correlation coefficient (R) of 0.367 and weighted average of 5.3%, a difference of 20.0%.
Unemployment Among Ages 65 to 74 years Correlation Summary
| Measurement | Puerto Rican | Immigrants from Chile |
| Minimum | 1.8% | 3.0% |
| Maximum | 38.6% | 13.5% |
| Range | 36.8% | 10.5% |
| Mean | 7.3% | 7.5% |
| Median | 6.1% | 6.7% |
| Interquartile 25% (IQ1) | 4.8% | 5.2% |
| Interquartile 75% (IQ3) | 8.1% | 9.7% |
| Interquartile Range (IQR) | 3.2% | 4.5% |
| Standard Deviation (Sample) | 4.9% | 3.0% |
| Standard Deviation (Population) | 4.8% | 2.9% |
Similar Demographics by Unemployment Among Ages 65 to 74 years
Demographics Similar to Puerto Ricans by Unemployment Among Ages 65 to 74 years
In terms of unemployment among ages 65 to 74 years, the demographic groups most similar to Puerto Ricans are Taiwanese (6.3%, a difference of 1.1%), Paiute (6.3%, a difference of 1.3%), Immigrants from Dominican Republic (6.3%, a difference of 1.3%), Immigrants from Armenia (6.5%, a difference of 1.6%), and Bermudan (6.3%, a difference of 1.7%).
| Demographics | Rating | Rank | Unemployment Among Ages 65 to 74 years |
| Immigrants | Azores | 0.0 /100 | #328 | Tragic 6.2% |
| Yuman | 0.0 /100 | #329 | Tragic 6.2% |
| Dominicans | 0.0 /100 | #330 | Tragic 6.3% |
| Bermudans | 0.0 /100 | #331 | Tragic 6.3% |
| Immigrants | Dominican Republic | 0.0 /100 | #332 | Tragic 6.3% |
| Paiute | 0.0 /100 | #333 | Tragic 6.3% |
| Taiwanese | 0.0 /100 | #334 | Tragic 6.3% |
| Puerto Ricans | 0.0 /100 | #335 | Tragic 6.4% |
| Immigrants | Armenia | 0.0 /100 | #336 | Tragic 6.5% |
| Ute | 0.0 /100 | #337 | Tragic 6.5% |
| Tlingit-Haida | 0.0 /100 | #338 | Tragic 6.5% |
| Yakama | 0.0 /100 | #339 | Tragic 6.6% |
| Pima | 0.0 /100 | #340 | Tragic 6.6% |
| Alaska Natives | 0.0 /100 | #341 | Tragic 6.8% |
| Navajo | 0.0 /100 | #342 | Tragic 6.9% |
Demographics Similar to Immigrants from Chile by Unemployment Among Ages 65 to 74 years
In terms of unemployment among ages 65 to 74 years, the demographic groups most similar to Immigrants from Chile are New Zealander (5.3%, a difference of 0.0%), Turkish (5.3%, a difference of 0.010%), Canadian (5.3%, a difference of 0.050%), Irish (5.3%, a difference of 0.060%), and Immigrants from Latvia (5.3%, a difference of 0.070%).
| Demographics | Rating | Rank | Unemployment Among Ages 65 to 74 years |
| Immigrants | Afghanistan | 80.8 /100 | #137 | Excellent 5.3% |
| Chileans | 79.7 /100 | #138 | Good 5.3% |
| Finns | 79.0 /100 | #139 | Good 5.3% |
| Immigrants | Laos | 78.6 /100 | #140 | Good 5.3% |
| Immigrants | Asia | 78.4 /100 | #141 | Good 5.3% |
| Turks | 76.2 /100 | #142 | Good 5.3% |
| New Zealanders | 76.1 /100 | #143 | Good 5.3% |
| Immigrants | Chile | 76.0 /100 | #144 | Good 5.3% |
| Canadians | 75.0 /100 | #145 | Good 5.3% |
| Irish | 74.8 /100 | #146 | Good 5.3% |
| Immigrants | Latvia | 74.6 /100 | #147 | Good 5.3% |
| Immigrants | Sri Lanka | 73.8 /100 | #148 | Good 5.3% |
| Immigrants | Romania | 73.5 /100 | #149 | Good 5.3% |
| Immigrants | Poland | 73.2 /100 | #150 | Good 5.3% |
| Immigrants | Indonesia | 72.9 /100 | #151 | Good 5.3% |