West Indian vs Immigrants from Bahamas Unemployment Among Women with Children Under 18 years
COMPARE
West Indian
Immigrants from Bahamas
Unemployment Among Women with Children Under 18 years
Unemployment Among Women with Children Under 18 years Comparison
West Indians
Immigrants from Bahamas
6.3%
UNEMPLOYMENT AMONG WOMEN WITH CHILDREN UNDER 18 YEARS
0.0/ 100
METRIC RATING
283rd/ 347
METRIC RANK
6.1%
UNEMPLOYMENT AMONG WOMEN WITH CHILDREN UNDER 18 YEARS
0.1/ 100
METRIC RATING
265th/ 347
METRIC RANK
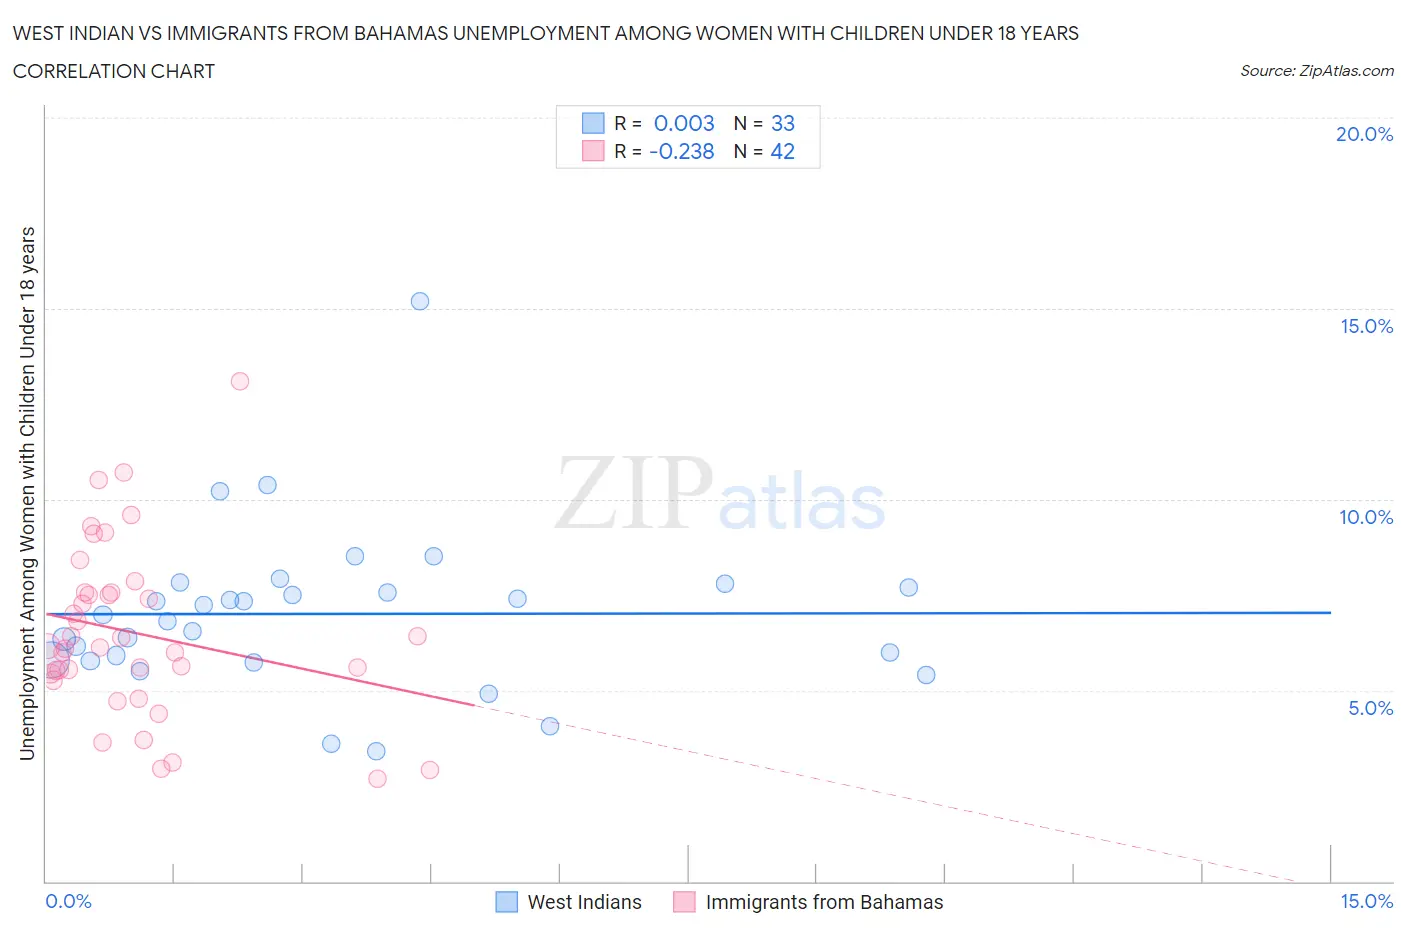
West Indian vs Immigrants from Bahamas Unemployment Among Women with Children Under 18 years Correlation Chart
The statistical analysis conducted on geographies consisting of 249,152,144 people shows no correlation between the proportion of West Indians and unemployment rate among women with children under the age of 18 in the United States with a correlation coefficient (R) of 0.003 and weighted average of 6.3%. Similarly, the statistical analysis conducted on geographies consisting of 103,539,940 people shows a weak negative correlation between the proportion of Immigrants from Bahamas and unemployment rate among women with children under the age of 18 in the United States with a correlation coefficient (R) of -0.238 and weighted average of 6.1%, a difference of 2.6%.
Unemployment Among Women with Children Under 18 years Correlation Summary
| Measurement | West Indian | Immigrants from Bahamas |
| Minimum | 3.4% | 2.7% |
| Maximum | 15.2% | 13.1% |
| Range | 11.8% | 10.4% |
| Mean | 7.0% | 6.5% |
| Median | 7.0% | 6.1% |
| Interquartile 25% (IQ1) | 5.8% | 5.4% |
| Interquartile 75% (IQ3) | 7.7% | 7.6% |
| Interquartile Range (IQR) | 2.0% | 2.1% |
| Standard Deviation (Sample) | 2.2% | 2.2% |
| Standard Deviation (Population) | 2.1% | 2.2% |
Demographics Similar to West Indians and Immigrants from Bahamas by Unemployment Among Women with Children Under 18 years
In terms of unemployment among women with children under 18 years, the demographic groups most similar to West Indians are Immigrants from Grenada (6.3%, a difference of 0.030%), Immigrants from St. Vincent and the Grenadines (6.3%, a difference of 0.18%), Immigrants from El Salvador (6.3%, a difference of 0.19%), Guatemalan (6.3%, a difference of 0.36%), and Immigrants from Portugal (6.3%, a difference of 0.86%). Similarly, the demographic groups most similar to Immigrants from Bahamas are Comanche (6.1%, a difference of 0.16%), Subsaharan African (6.2%, a difference of 0.33%), French American Indian (6.2%, a difference of 0.35%), Trinidadian and Tobagonian (6.2%, a difference of 0.36%), and Cajun (6.2%, a difference of 0.40%).
| Demographics | Rating | Rank | Unemployment Among Women with Children Under 18 years |
| Comanche | 0.1 /100 | #264 | Tragic 6.1% |
| Immigrants | Bahamas | 0.1 /100 | #265 | Tragic 6.1% |
| Sub-Saharan Africans | 0.1 /100 | #266 | Tragic 6.2% |
| French American Indians | 0.1 /100 | #267 | Tragic 6.2% |
| Trinidadians and Tobagonians | 0.1 /100 | #268 | Tragic 6.2% |
| Cajuns | 0.1 /100 | #269 | Tragic 6.2% |
| Ghanaians | 0.1 /100 | #270 | Tragic 6.2% |
| Central Americans | 0.0 /100 | #271 | Tragic 6.2% |
| Salvadorans | 0.0 /100 | #272 | Tragic 6.2% |
| Immigrants | Western Africa | 0.0 /100 | #273 | Tragic 6.2% |
| Senegalese | 0.0 /100 | #274 | Tragic 6.2% |
| Dutch West Indians | 0.0 /100 | #275 | Tragic 6.2% |
| Immigrants | Ghana | 0.0 /100 | #276 | Tragic 6.2% |
| Mexican American Indians | 0.0 /100 | #277 | Tragic 6.2% |
| Immigrants | Barbados | 0.0 /100 | #278 | Tragic 6.2% |
| Immigrants | Portugal | 0.0 /100 | #279 | Tragic 6.3% |
| Guatemalans | 0.0 /100 | #280 | Tragic 6.3% |
| Immigrants | El Salvador | 0.0 /100 | #281 | Tragic 6.3% |
| Immigrants | St. Vincent and the Grenadines | 0.0 /100 | #282 | Tragic 6.3% |
| West Indians | 0.0 /100 | #283 | Tragic 6.3% |
| Immigrants | Grenada | 0.0 /100 | #284 | Tragic 6.3% |