Pima vs Japanese Unemployment Among Women with Children Under 18 years
COMPARE
Pima
Japanese
Unemployment Among Women with Children Under 18 years
Unemployment Among Women with Children Under 18 years Comparison
Pima
Japanese
11.7%
UNEMPLOYMENT AMONG WOMEN WITH CHILDREN UNDER 18 YEARS
0.0/ 100
METRIC RATING
347th/ 347
METRIC RANK
5.7%
UNEMPLOYMENT AMONG WOMEN WITH CHILDREN UNDER 18 YEARS
8.7/ 100
METRIC RATING
214th/ 347
METRIC RANK
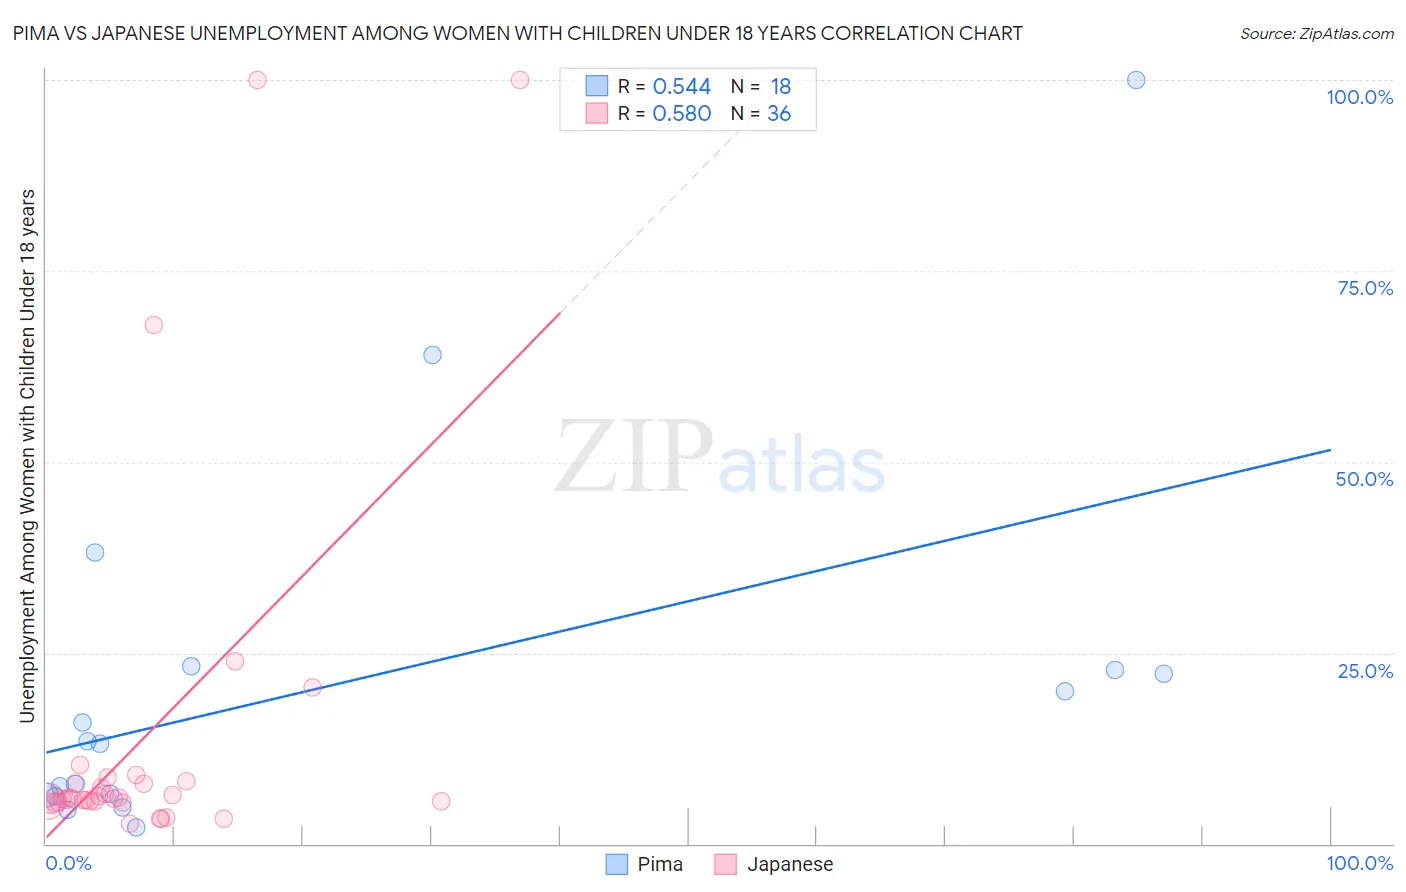
Pima vs Japanese Unemployment Among Women with Children Under 18 years Correlation Chart
The statistical analysis conducted on geographies consisting of 60,829,191 people shows a substantial positive correlation between the proportion of Pima and unemployment rate among women with children under the age of 18 in the United States with a correlation coefficient (R) of 0.544 and weighted average of 11.7%. Similarly, the statistical analysis conducted on geographies consisting of 244,244,849 people shows a substantial positive correlation between the proportion of Japanese and unemployment rate among women with children under the age of 18 in the United States with a correlation coefficient (R) of 0.580 and weighted average of 5.7%, a difference of 106.1%.
Unemployment Among Women with Children Under 18 years Correlation Summary
| Measurement | Pima | Japanese |
| Minimum | 2.2% | 2.6% |
| Maximum | 100.0% | 100.0% |
| Range | 97.8% | 97.4% |
| Mean | 21.0% | 13.8% |
| Median | 13.2% | 5.9% |
| Interquartile 25% (IQ1) | 6.3% | 5.5% |
| Interquartile 75% (IQ3) | 22.8% | 8.0% |
| Interquartile Range (IQR) | 16.5% | 2.6% |
| Standard Deviation (Sample) | 24.8% | 23.9% |
| Standard Deviation (Population) | 24.1% | 23.5% |
Similar Demographics by Unemployment Among Women with Children Under 18 years
Demographics Similar to Pima by Unemployment Among Women with Children Under 18 years
In terms of unemployment among women with children under 18 years, the demographic groups most similar to Pima are Yup'ik (11.0%, a difference of 6.0%), Yuman (9.8%, a difference of 19.7%), Inupiat (9.6%, a difference of 22.0%), Arapaho (9.2%, a difference of 27.1%), and Puerto Rican (9.0%, a difference of 29.8%).
| Demographics | Rating | Rank | Unemployment Among Women with Children Under 18 years |
| Immigrants | Dominican Republic | 0.0 /100 | #333 | Tragic 7.5% |
| Cheyenne | 0.0 /100 | #334 | Tragic 7.8% |
| Apache | 0.0 /100 | #335 | Tragic 7.9% |
| Sioux | 0.0 /100 | #336 | Tragic 7.9% |
| Yakama | 0.0 /100 | #337 | Tragic 8.1% |
| Immigrants | Yemen | 0.0 /100 | #338 | Tragic 8.2% |
| Navajo | 0.0 /100 | #339 | Tragic 8.2% |
| Crow | 0.0 /100 | #340 | Tragic 8.2% |
| Tohono O'odham | 0.0 /100 | #341 | Tragic 8.9% |
| Puerto Ricans | 0.0 /100 | #342 | Tragic 9.0% |
| Arapaho | 0.0 /100 | #343 | Tragic 9.2% |
| Inupiat | 0.0 /100 | #344 | Tragic 9.6% |
| Yuman | 0.0 /100 | #345 | Tragic 9.8% |
| Yup'ik | 0.0 /100 | #346 | Tragic 11.0% |
| Pima | 0.0 /100 | #347 | Tragic 11.7% |
Demographics Similar to Japanese by Unemployment Among Women with Children Under 18 years
In terms of unemployment among women with children under 18 years, the demographic groups most similar to Japanese are American (5.7%, a difference of 0.040%), Immigrants from Uganda (5.7%, a difference of 0.20%), South American (5.7%, a difference of 0.25%), Panamanian (5.7%, a difference of 0.26%), and Immigrants from Peru (5.7%, a difference of 0.30%).
| Demographics | Rating | Rank | Unemployment Among Women with Children Under 18 years |
| Peruvians | 12.1 /100 | #207 | Poor 5.6% |
| Immigrants | Costa Rica | 11.6 /100 | #208 | Poor 5.6% |
| Immigrants | Western Asia | 11.3 /100 | #209 | Poor 5.6% |
| Immigrants | Nonimmigrants | 10.6 /100 | #210 | Poor 5.7% |
| Panamanians | 10.1 /100 | #211 | Poor 5.7% |
| South Americans | 10.0 /100 | #212 | Poor 5.7% |
| Americans | 8.9 /100 | #213 | Tragic 5.7% |
| Japanese | 8.7 /100 | #214 | Tragic 5.7% |
| Immigrants | Uganda | 7.9 /100 | #215 | Tragic 5.7% |
| Immigrants | Peru | 7.4 /100 | #216 | Tragic 5.7% |
| Immigrants | Brazil | 7.1 /100 | #217 | Tragic 5.7% |
| Immigrants | Nicaragua | 7.0 /100 | #218 | Tragic 5.7% |
| Iroquois | 6.5 /100 | #219 | Tragic 5.7% |
| Immigrants | Fiji | 6.3 /100 | #220 | Tragic 5.7% |
| Pennsylvania Germans | 5.7 /100 | #221 | Tragic 5.7% |