Immigrants from Northern Africa vs Immigrants from Israel Unemployment Among Ages 55 to 59 years
COMPARE
Immigrants from Northern Africa
Immigrants from Israel
Unemployment Among Ages 55 to 59 years
Unemployment Among Ages 55 to 59 years Comparison
Immigrants from Northern Africa
Immigrants from Israel
4.8%
UNEMPLOYMENT AMONG AGES 55 TO 59 YEARS
69.8/ 100
METRIC RATING
150th/ 347
METRIC RANK
5.3%
UNEMPLOYMENT AMONG AGES 55 TO 59 YEARS
0.0/ 100
METRIC RATING
288th/ 347
METRIC RANK
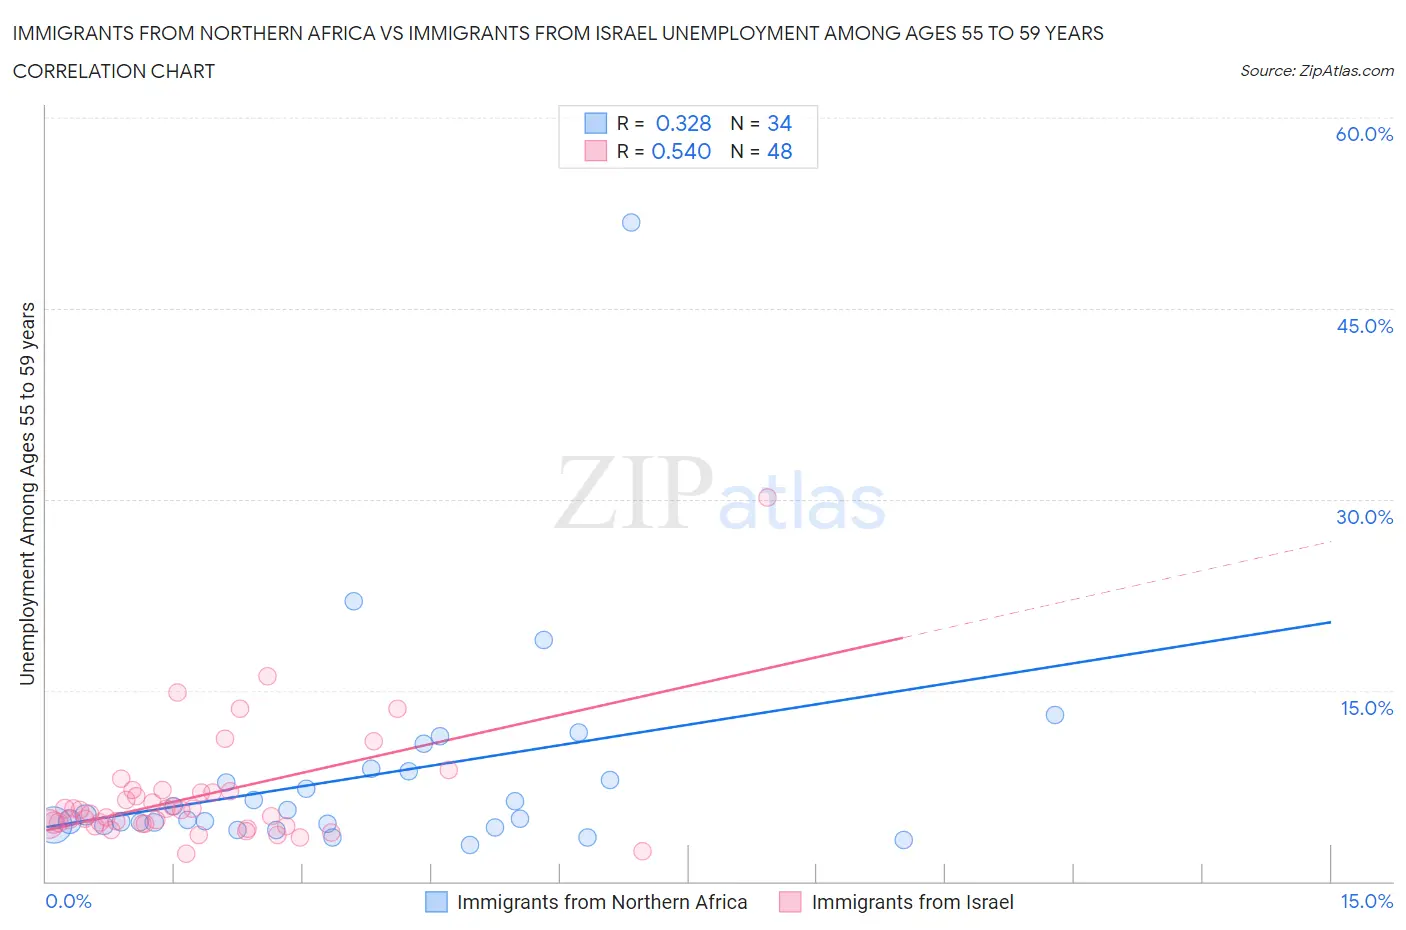
Immigrants from Northern Africa vs Immigrants from Israel Unemployment Among Ages 55 to 59 years Correlation Chart
The statistical analysis conducted on geographies consisting of 306,075,168 people shows a mild positive correlation between the proportion of Immigrants from Northern Africa and unemployment rate among population between the ages 55 and 59 in the United States with a correlation coefficient (R) of 0.328 and weighted average of 4.8%. Similarly, the statistical analysis conducted on geographies consisting of 204,057,833 people shows a substantial positive correlation between the proportion of Immigrants from Israel and unemployment rate among population between the ages 55 and 59 in the United States with a correlation coefficient (R) of 0.540 and weighted average of 5.3%, a difference of 10.8%.
Unemployment Among Ages 55 to 59 years Correlation Summary
| Measurement | Immigrants from Northern Africa | Immigrants from Israel |
| Minimum | 2.9% | 2.2% |
| Maximum | 51.8% | 30.1% |
| Range | 48.9% | 27.9% |
| Mean | 8.3% | 6.7% |
| Median | 5.0% | 5.5% |
| Interquartile 25% (IQ1) | 4.4% | 4.5% |
| Interquartile 75% (IQ3) | 8.7% | 7.0% |
| Interquartile Range (IQR) | 4.2% | 2.5% |
| Standard Deviation (Sample) | 8.8% | 4.6% |
| Standard Deviation (Population) | 8.7% | 4.6% |
Similar Demographics by Unemployment Among Ages 55 to 59 years
Demographics Similar to Immigrants from Northern Africa by Unemployment Among Ages 55 to 59 years
In terms of unemployment among ages 55 to 59 years, the demographic groups most similar to Immigrants from Northern Africa are Immigrants from Lithuania (4.8%, a difference of 0.050%), Bahamian (4.8%, a difference of 0.060%), Laotian (4.8%, a difference of 0.080%), Immigrants from Bahamas (4.8%, a difference of 0.10%), and Immigrants from Uruguay (4.8%, a difference of 0.12%).
| Demographics | Rating | Rank | Unemployment Among Ages 55 to 59 years |
| Ukrainians | 78.6 /100 | #143 | Good 4.8% |
| Immigrants | Asia | 77.8 /100 | #144 | Good 4.8% |
| Immigrants | Northern Europe | 77.5 /100 | #145 | Good 4.8% |
| Immigrants | South Eastern Asia | 77.4 /100 | #146 | Good 4.8% |
| Immigrants | Singapore | 76.6 /100 | #147 | Good 4.8% |
| Immigrants | Bahamas | 71.8 /100 | #148 | Good 4.8% |
| Immigrants | Lithuania | 70.8 /100 | #149 | Good 4.8% |
| Immigrants | Northern Africa | 69.8 /100 | #150 | Good 4.8% |
| Bahamians | 68.6 /100 | #151 | Good 4.8% |
| Laotians | 68.2 /100 | #152 | Good 4.8% |
| Immigrants | Uruguay | 67.2 /100 | #153 | Good 4.8% |
| Immigrants | Panama | 66.8 /100 | #154 | Good 4.8% |
| Immigrants | North Macedonia | 66.3 /100 | #155 | Good 4.8% |
| Italians | 66.2 /100 | #156 | Good 4.8% |
| Carpatho Rusyns | 66.0 /100 | #157 | Good 4.8% |
Demographics Similar to Immigrants from Israel by Unemployment Among Ages 55 to 59 years
In terms of unemployment among ages 55 to 59 years, the demographic groups most similar to Immigrants from Israel are Immigrants from Guatemala (5.3%, a difference of 0.010%), Immigrants from Ghana (5.3%, a difference of 0.030%), Immigrants from Central America (5.3%, a difference of 0.060%), Sioux (5.3%, a difference of 0.090%), and Armenian (5.3%, a difference of 0.15%).
| Demographics | Rating | Rank | Unemployment Among Ages 55 to 59 years |
| Guatemalans | 0.0 /100 | #281 | Tragic 5.3% |
| Immigrants | Trinidad and Tobago | 0.0 /100 | #282 | Tragic 5.3% |
| Apache | 0.0 /100 | #283 | Tragic 5.3% |
| Ghanaians | 0.0 /100 | #284 | Tragic 5.3% |
| Armenians | 0.0 /100 | #285 | Tragic 5.3% |
| Immigrants | Ghana | 0.0 /100 | #286 | Tragic 5.3% |
| Immigrants | Guatemala | 0.0 /100 | #287 | Tragic 5.3% |
| Immigrants | Israel | 0.0 /100 | #288 | Tragic 5.3% |
| Immigrants | Central America | 0.0 /100 | #289 | Tragic 5.3% |
| Sioux | 0.0 /100 | #290 | Tragic 5.3% |
| Trinidadians and Tobagonians | 0.0 /100 | #291 | Tragic 5.3% |
| British West Indians | 0.0 /100 | #292 | Tragic 5.3% |
| Immigrants | Grenada | 0.0 /100 | #293 | Tragic 5.3% |
| Cajuns | 0.0 /100 | #294 | Tragic 5.3% |
| Dutch West Indians | 0.0 /100 | #295 | Tragic 5.3% |