Macedonian vs Immigrants from Cameroon Unemployment Among Women with Children Under 6 years
COMPARE
Macedonian
Immigrants from Cameroon
Unemployment Among Women with Children Under 6 years
Unemployment Among Women with Children Under 6 years Comparison
Macedonians
Immigrants from Cameroon
7.2%
UNEMPLOYMENT AMONG WOMEN WITH CHILDREN UNDER 6 YEARS
97.7/ 100
METRIC RATING
94th/ 347
METRIC RANK
8.6%
UNEMPLOYMENT AMONG WOMEN WITH CHILDREN UNDER 6 YEARS
0.1/ 100
METRIC RATING
274th/ 347
METRIC RANK
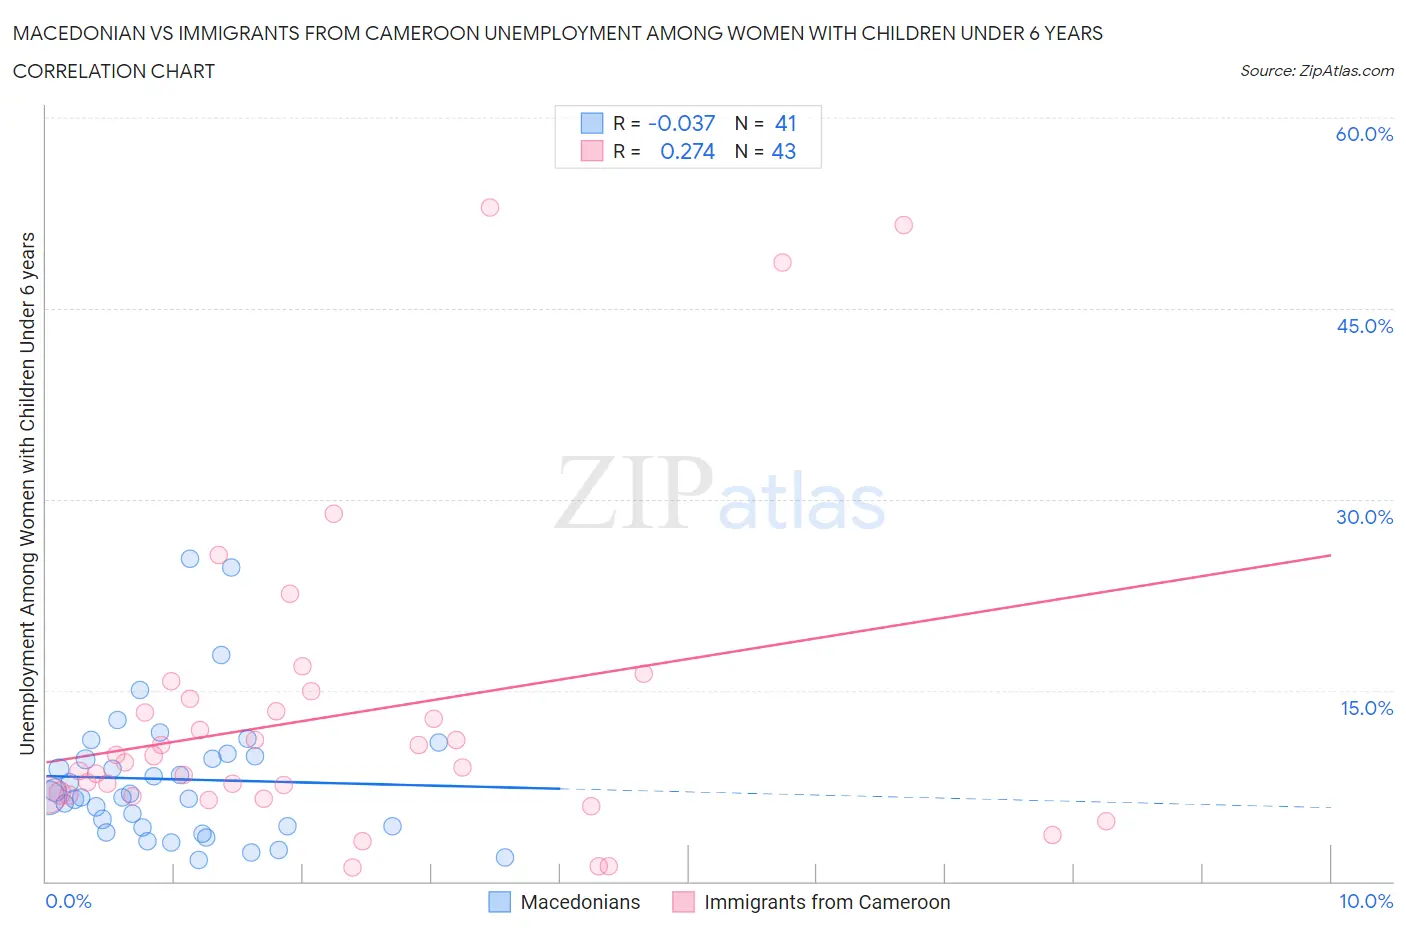
Macedonian vs Immigrants from Cameroon Unemployment Among Women with Children Under 6 years Correlation Chart
The statistical analysis conducted on geographies consisting of 112,540,852 people shows no correlation between the proportion of Macedonians and unemployment rate among women with children under the age of 6 in the United States with a correlation coefficient (R) of -0.037 and weighted average of 7.2%. Similarly, the statistical analysis conducted on geographies consisting of 118,311,400 people shows a weak positive correlation between the proportion of Immigrants from Cameroon and unemployment rate among women with children under the age of 6 in the United States with a correlation coefficient (R) of 0.274 and weighted average of 8.6%, a difference of 19.6%.
Unemployment Among Women with Children Under 6 years Correlation Summary
| Measurement | Macedonian | Immigrants from Cameroon |
| Minimum | 1.7% | 1.1% |
| Maximum | 25.3% | 52.9% |
| Range | 23.6% | 51.8% |
| Mean | 8.0% | 13.0% |
| Median | 6.6% | 9.3% |
| Interquartile 25% (IQ1) | 4.3% | 6.8% |
| Interquartile 75% (IQ3) | 9.9% | 14.4% |
| Interquartile Range (IQR) | 5.6% | 7.6% |
| Standard Deviation (Sample) | 5.3% | 12.1% |
| Standard Deviation (Population) | 5.2% | 11.9% |
Similar Demographics by Unemployment Among Women with Children Under 6 years
Demographics Similar to Macedonians by Unemployment Among Women with Children Under 6 years
In terms of unemployment among women with children under 6 years, the demographic groups most similar to Macedonians are Romanian (7.2%, a difference of 0.040%), Immigrants from Eastern Africa (7.2%, a difference of 0.060%), New Zealander (7.2%, a difference of 0.070%), Immigrants from South Eastern Asia (7.2%, a difference of 0.13%), and Russian (7.2%, a difference of 0.17%).
| Demographics | Rating | Rank | Unemployment Among Women with Children Under 6 years |
| Alsatians | 98.4 /100 | #87 | Exceptional 7.1% |
| Immigrants | Hungary | 98.3 /100 | #88 | Exceptional 7.1% |
| Immigrants | Denmark | 98.3 /100 | #89 | Exceptional 7.1% |
| Immigrants | Spain | 98.2 /100 | #90 | Exceptional 7.1% |
| Danes | 98.2 /100 | #91 | Exceptional 7.1% |
| Albanians | 98.0 /100 | #92 | Exceptional 7.2% |
| New Zealanders | 97.8 /100 | #93 | Exceptional 7.2% |
| Macedonians | 97.7 /100 | #94 | Exceptional 7.2% |
| Romanians | 97.7 /100 | #95 | Exceptional 7.2% |
| Immigrants | Eastern Africa | 97.7 /100 | #96 | Exceptional 7.2% |
| Immigrants | South Eastern Asia | 97.6 /100 | #97 | Exceptional 7.2% |
| Russians | 97.5 /100 | #98 | Exceptional 7.2% |
| Immigrants | Europe | 97.5 /100 | #99 | Exceptional 7.2% |
| Immigrants | Northern Europe | 97.4 /100 | #100 | Exceptional 7.2% |
| Chileans | 97.4 /100 | #101 | Exceptional 7.2% |
Demographics Similar to Immigrants from Cameroon by Unemployment Among Women with Children Under 6 years
In terms of unemployment among women with children under 6 years, the demographic groups most similar to Immigrants from Cameroon are Immigrants from Latin America (8.6%, a difference of 0.050%), Yaqui (8.6%, a difference of 0.40%), Haitian (8.6%, a difference of 0.50%), Slovak (8.5%, a difference of 0.67%), and Mexican American Indian (8.5%, a difference of 0.75%).
| Demographics | Rating | Rank | Unemployment Among Women with Children Under 6 years |
| Belizeans | 0.2 /100 | #267 | Tragic 8.4% |
| Sub-Saharan Africans | 0.2 /100 | #268 | Tragic 8.4% |
| Immigrants | Haiti | 0.2 /100 | #269 | Tragic 8.4% |
| Immigrants | Senegal | 0.2 /100 | #270 | Tragic 8.5% |
| Immigrants | Congo | 0.2 /100 | #271 | Tragic 8.5% |
| Mexican American Indians | 0.1 /100 | #272 | Tragic 8.5% |
| Slovaks | 0.1 /100 | #273 | Tragic 8.5% |
| Immigrants | Cameroon | 0.1 /100 | #274 | Tragic 8.6% |
| Immigrants | Latin America | 0.1 /100 | #275 | Tragic 8.6% |
| Yaqui | 0.0 /100 | #276 | Tragic 8.6% |
| Haitians | 0.0 /100 | #277 | Tragic 8.6% |
| Immigrants | Dominica | 0.0 /100 | #278 | Tragic 8.6% |
| Immigrants | Guatemala | 0.0 /100 | #279 | Tragic 8.6% |
| Immigrants | Belize | 0.0 /100 | #280 | Tragic 8.6% |
| Guatemalans | 0.0 /100 | #281 | Tragic 8.7% |