French Canadian vs Marshallese Unemployment Among Women with Children Under 18 years
COMPARE
French Canadian
Marshallese
Unemployment Among Women with Children Under 18 years
Unemployment Among Women with Children Under 18 years Comparison
French Canadians
Marshallese
5.2%
UNEMPLOYMENT AMONG WOMEN WITH CHILDREN UNDER 18 YEARS
88.9/ 100
METRIC RATING
111th/ 347
METRIC RANK
5.6%
UNEMPLOYMENT AMONG WOMEN WITH CHILDREN UNDER 18 YEARS
20.2/ 100
METRIC RATING
199th/ 347
METRIC RANK
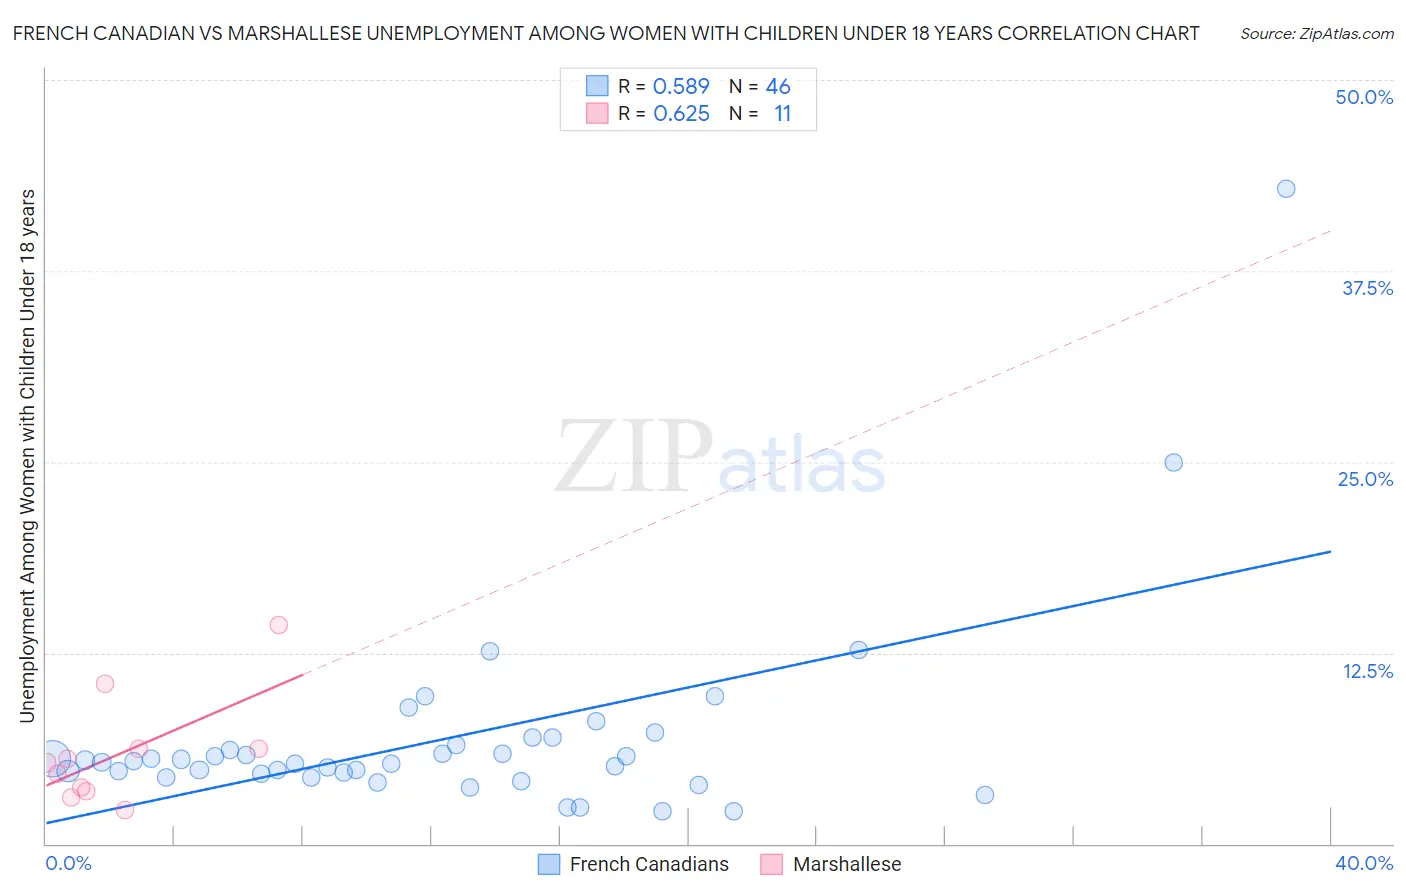
French Canadian vs Marshallese Unemployment Among Women with Children Under 18 years Correlation Chart
The statistical analysis conducted on geographies consisting of 465,765,550 people shows a substantial positive correlation between the proportion of French Canadians and unemployment rate among women with children under the age of 18 in the United States with a correlation coefficient (R) of 0.589 and weighted average of 5.2%. Similarly, the statistical analysis conducted on geographies consisting of 14,610,799 people shows a significant positive correlation between the proportion of Marshallese and unemployment rate among women with children under the age of 18 in the United States with a correlation coefficient (R) of 0.625 and weighted average of 5.6%, a difference of 6.4%.
Unemployment Among Women with Children Under 18 years Correlation Summary
| Measurement | French Canadian | Marshallese |
| Minimum | 2.1% | 2.2% |
| Maximum | 42.9% | 14.3% |
| Range | 40.8% | 12.1% |
| Mean | 6.9% | 5.9% |
| Median | 5.4% | 5.3% |
| Interquartile 25% (IQ1) | 4.6% | 3.4% |
| Interquartile 75% (IQ3) | 6.5% | 6.2% |
| Interquartile Range (IQR) | 1.9% | 2.8% |
| Standard Deviation (Sample) | 6.5% | 3.6% |
| Standard Deviation (Population) | 6.5% | 3.4% |
Similar Demographics by Unemployment Among Women with Children Under 18 years
Demographics Similar to French Canadians by Unemployment Among Women with Children Under 18 years
In terms of unemployment among women with children under 18 years, the demographic groups most similar to French Canadians are Immigrants from Czechoslovakia (5.2%, a difference of 0.0%), Immigrants from Russia (5.2%, a difference of 0.020%), Immigrants from Eastern Europe (5.2%, a difference of 0.070%), French (5.2%, a difference of 0.090%), and Kenyan (5.3%, a difference of 0.13%).
| Demographics | Rating | Rank | Unemployment Among Women with Children Under 18 years |
| Immigrants | Switzerland | 90.1 /100 | #104 | Exceptional 5.2% |
| Immigrants | France | 90.0 /100 | #105 | Excellent 5.2% |
| Pakistanis | 89.9 /100 | #106 | Excellent 5.2% |
| Slavs | 89.8 /100 | #107 | Excellent 5.2% |
| Iranians | 89.7 /100 | #108 | Excellent 5.2% |
| Immigrants | Russia | 89.0 /100 | #109 | Excellent 5.2% |
| Immigrants | Czechoslovakia | 88.9 /100 | #110 | Excellent 5.2% |
| French Canadians | 88.9 /100 | #111 | Excellent 5.2% |
| Immigrants | Eastern Europe | 88.5 /100 | #112 | Excellent 5.2% |
| French | 88.4 /100 | #113 | Excellent 5.2% |
| Kenyans | 88.2 /100 | #114 | Excellent 5.3% |
| Hungarians | 88.1 /100 | #115 | Excellent 5.3% |
| Macedonians | 87.7 /100 | #116 | Excellent 5.3% |
| Canadians | 87.4 /100 | #117 | Excellent 5.3% |
| Immigrants | Europe | 86.7 /100 | #118 | Excellent 5.3% |
Demographics Similar to Marshallese by Unemployment Among Women with Children Under 18 years
In terms of unemployment among women with children under 18 years, the demographic groups most similar to Marshallese are Immigrants from Colombia (5.6%, a difference of 0.13%), Arab (5.6%, a difference of 0.13%), Menominee (5.6%, a difference of 0.18%), Immigrants from Morocco (5.6%, a difference of 0.26%), and Spaniard (5.6%, a difference of 0.27%).
| Demographics | Rating | Rank | Unemployment Among Women with Children Under 18 years |
| Immigrants | Spain | 30.7 /100 | #192 | Fair 5.5% |
| Immigrants | Afghanistan | 29.3 /100 | #193 | Fair 5.5% |
| Immigrants | Chile | 29.2 /100 | #194 | Fair 5.5% |
| Colombians | 22.8 /100 | #195 | Fair 5.6% |
| Spaniards | 22.8 /100 | #196 | Fair 5.6% |
| Immigrants | Colombia | 21.4 /100 | #197 | Fair 5.6% |
| Arabs | 21.4 /100 | #198 | Fair 5.6% |
| Marshallese | 20.2 /100 | #199 | Fair 5.6% |
| Menominee | 18.6 /100 | #200 | Poor 5.6% |
| Immigrants | Morocco | 17.9 /100 | #201 | Poor 5.6% |
| Immigrants | Micronesia | 17.1 /100 | #202 | Poor 5.6% |
| Portuguese | 15.9 /100 | #203 | Poor 5.6% |
| Israelis | 15.6 /100 | #204 | Poor 5.6% |
| Tsimshian | 15.2 /100 | #205 | Poor 5.6% |
| Nicaraguans | 12.3 /100 | #206 | Poor 5.6% |