Sierra Leonean vs Malaysian Male Unemployment
COMPARE
Sierra Leonean
Malaysian
Male Unemployment
Male Unemployment Comparison
Sierra Leoneans
Malaysians
6.2%
MALE UNEMPLOYMENT
0.0/ 100
METRIC RATING
281st/ 347
METRIC RANK
5.3%
MALE UNEMPLOYMENT
39.6/ 100
METRIC RATING
180th/ 347
METRIC RANK
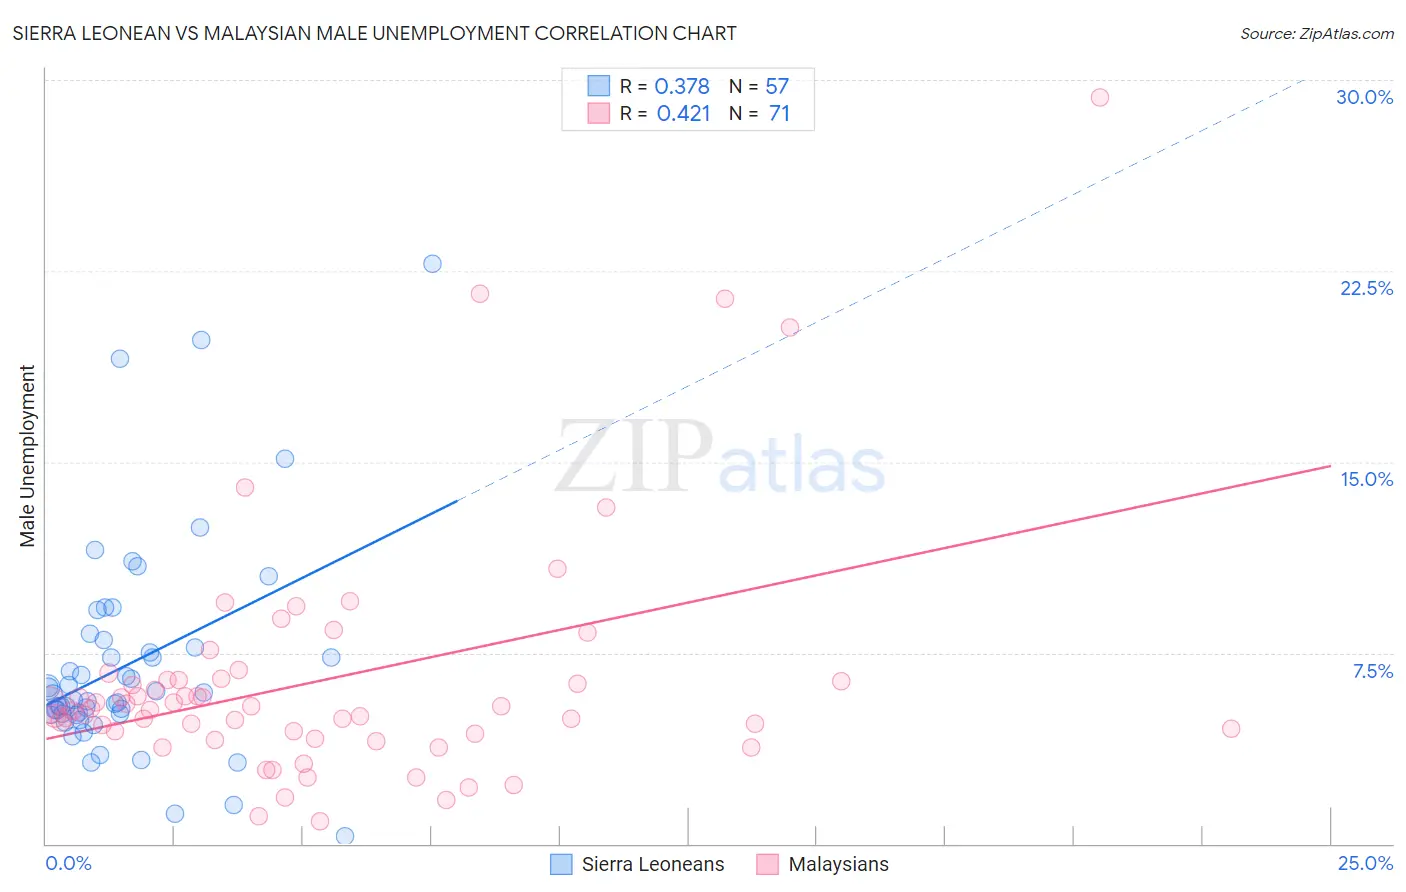
Sierra Leonean vs Malaysian Male Unemployment Correlation Chart
The statistical analysis conducted on geographies consisting of 83,306,317 people shows a mild positive correlation between the proportion of Sierra Leoneans and unemployment rate among males in the United States with a correlation coefficient (R) of 0.378 and weighted average of 6.2%. Similarly, the statistical analysis conducted on geographies consisting of 225,737,190 people shows a moderate positive correlation between the proportion of Malaysians and unemployment rate among males in the United States with a correlation coefficient (R) of 0.421 and weighted average of 5.3%, a difference of 15.6%.
Male Unemployment Correlation Summary
| Measurement | Sierra Leonean | Malaysian |
| Minimum | 0.30% | 0.90% |
| Maximum | 22.8% | 29.3% |
| Range | 22.5% | 28.4% |
| Mean | 7.0% | 6.4% |
| Median | 5.9% | 5.3% |
| Interquartile 25% (IQ1) | 5.1% | 4.3% |
| Interquartile 75% (IQ3) | 7.9% | 6.4% |
| Interquartile Range (IQR) | 2.8% | 2.1% |
| Standard Deviation (Sample) | 4.2% | 4.8% |
| Standard Deviation (Population) | 4.2% | 4.8% |
Similar Demographics by Male Unemployment
Demographics Similar to Sierra Leoneans by Male Unemployment
In terms of male unemployment, the demographic groups most similar to Sierra Leoneans are Immigrants from Ghana (6.2%, a difference of 0.070%), Ecuadorian (6.2%, a difference of 0.43%), Immigrants from Western Africa (6.2%, a difference of 0.46%), Ghanaian (6.1%, a difference of 1.1%), and Spanish American Indian (6.2%, a difference of 1.1%).
| Demographics | Rating | Rank | Male Unemployment |
| Immigrants | Sierra Leone | 0.0 /100 | #274 | Tragic 6.0% |
| Menominee | 0.0 /100 | #275 | Tragic 6.0% |
| Tlingit-Haida | 0.0 /100 | #276 | Tragic 6.0% |
| Immigrants | Liberia | 0.0 /100 | #277 | Tragic 6.1% |
| Immigrants | Fiji | 0.0 /100 | #278 | Tragic 6.1% |
| Ghanaians | 0.0 /100 | #279 | Tragic 6.1% |
| Immigrants | Ghana | 0.0 /100 | #280 | Tragic 6.2% |
| Sierra Leoneans | 0.0 /100 | #281 | Tragic 6.2% |
| Ecuadorians | 0.0 /100 | #282 | Tragic 6.2% |
| Immigrants | Western Africa | 0.0 /100 | #283 | Tragic 6.2% |
| Spanish American Indians | 0.0 /100 | #284 | Tragic 6.2% |
| Immigrants | Ecuador | 0.0 /100 | #285 | Tragic 6.2% |
| Africans | 0.0 /100 | #286 | Tragic 6.3% |
| Central American Indians | 0.0 /100 | #287 | Tragic 6.3% |
| Immigrants | Senegal | 0.0 /100 | #288 | Tragic 6.3% |
Demographics Similar to Malaysians by Male Unemployment
In terms of male unemployment, the demographic groups most similar to Malaysians are Immigrants from Oceania (5.3%, a difference of 0.070%), Immigrants from Afghanistan (5.3%, a difference of 0.10%), Potawatomi (5.3%, a difference of 0.11%), Taiwanese (5.3%, a difference of 0.12%), and Osage (5.3%, a difference of 0.17%).
| Demographics | Rating | Rank | Male Unemployment |
| Immigrants | Russia | 50.7 /100 | #173 | Average 5.3% |
| Immigrants | Iran | 50.0 /100 | #174 | Average 5.3% |
| Immigrants | Iraq | 48.1 /100 | #175 | Average 5.3% |
| Immigrants | Poland | 46.0 /100 | #176 | Average 5.3% |
| Immigrants | Peru | 44.6 /100 | #177 | Average 5.3% |
| Osage | 42.5 /100 | #178 | Average 5.3% |
| Immigrants | Oceania | 40.8 /100 | #179 | Average 5.3% |
| Malaysians | 39.6 /100 | #180 | Fair 5.3% |
| Immigrants | Afghanistan | 37.9 /100 | #181 | Fair 5.3% |
| Potawatomi | 37.8 /100 | #182 | Fair 5.3% |
| Taiwanese | 37.6 /100 | #183 | Fair 5.3% |
| Spaniards | 35.1 /100 | #184 | Fair 5.3% |
| Koreans | 34.9 /100 | #185 | Fair 5.3% |
| Iraqis | 31.6 /100 | #186 | Fair 5.4% |
| Costa Ricans | 31.3 /100 | #187 | Fair 5.4% |