Pennsylvania German vs Immigrants from Middle Africa Unemployment Among Ages 30 to 34 years

COMPARE

Pennsylvania German
Race
Ancestry
AfghanAfricanAlaska NativeAlaskan AthabascanAlbanianAleutAlsatianAmericanApacheArabArapahoArgentineanArmenianAssyrian/Chaldean/SyriacAustralianAustrianBahamianBangladeshiBarbadianBasqueBelgianBelizeanBermudanBhutaneseBlackfeetBolivianBrazilianBritishBritish West IndianBulgarianBurmeseCajunCambodianCanadianCape VerdeanCarpatho RusynCelticCentral AmericanCentral American IndianCherokeeCheyenneChickasawChileanChineseChippewaChoctawColombianColvilleComancheCosta RicanCreeCreekCroatianCrowCubanCypriotCzechCzechoslovakianDanishDelawareDominicanDutchDutch West IndianEastern EuropeanEcuadorianEgyptianEnglishEstonianEthiopianEuropeanFijianFilipinoFinnishFrenchFrench American IndianFrench CanadianGermanGerman RussianGhanaianGreekGuamanian/ChamorroGuatemalanGuyaneseHaitianHmongHonduranHopiHoumaHungarianIcelanderIndian (Asian)IndonesianInupiatIranianIraqiIrishIroquoisIsraeliItalianJamaicanJapaneseJordanianKenyanKiowaKoreanLaotianLatvianLebaneseLiberianLithuanianLumbeeLuxembourgerMacedonianMalaysianMalteseMarshalleseMenomineeMexicanMexican American IndianMongolianMoroccanNative HawaiianNavajoNepaleseNew ZealanderNicaraguanNigerianNorthern EuropeanNorwegianOkinawanOsageOttawaPaiutePakistaniPalestinianPanamanianParaguayanPennsylvania GermanPeruvianPimaPolishPortuguesePotawatomiPuebloPuerto RicanPuget Sound SalishRomanianRussianSalvadoranSamoanScandinavianScotch-IrishScottishSeminoleSenegaleseSerbianShoshoneSierra LeoneanSiouxSlavicSlovakSloveneSomaliSouth AfricanSouth AmericanSouth American IndianSoviet UnionSpaniardSpanishSpanish AmericanSpanish American IndianSri LankanSubsaharan AfricanSudaneseSwedishSwissSyrianTaiwaneseThaiTlingit-HaidaTohono O'OdhamTonganTrinidadian and TobagonianTsimshianTurkishU.S. Virgin IslanderUgandanUkrainianUruguayanUteVenezuelanVietnameseWelshWest IndianYakamaYaquiYugoslavianYumanYup'ikZimbabwean
Immigration
NonimmigrantsImmigrantsAfghanistanAfricaAlbaniaArgentinaArmeniaAsiaAustraliaAustriaBahamasBangladeshBarbadosBelarusBelgiumBelizeBoliviaBosnia and HerzegovinaBrazilBulgariaBurma/MyanmarCabo VerdeCambodiaCameroonCanadaCaribbeanCentral AmericaChileChinaColombiaCongoCosta RicaCroatiaCubaCzechoslovakiaDenmarkDominicaDominican RepublicEastern AfricaEastern AsiaEastern EuropeEcuadorEgyptEl SalvadorEnglandEritreaEthiopiaEuropeFijiFranceGermanyGhanaGreeceGrenadaGuatemalaGuyanaHaitiHondurasHong KongHungaryIndiaIndonesiaIranIraqIrelandIsraelItalyJamaicaJapanJordanKazakhstanKenyaKoreaKuwaitLaosLatin AmericaLatviaLebanonLiberiaLithuaniaMalaysiaMexicoMicronesiaMoldovaMoroccoNepalNetherlandsNicaraguaNigeriaNorth AmericaNorth MacedoniaNorthern AfricaNorthern EuropeNorwayOceaniaPakistanPanamaPeruPhilippinesPolandPortugalRomaniaRussiaSaudi ArabiaScotlandSenegalSerbiaSierra LeoneSingaporeSomaliaSouth AfricaSouth AmericaSouth Central AsiaSouth Eastern AsiaSouthern EuropeSpainSri LankaSt. Vincent and the GrenadinesSudanSwedenSwitzerlandSyriaTaiwanThailandTrinidad and TobagoTurkeyUgandaUkraineUruguayUzbekistanVenezuelaVietnamWest IndiesWestern AfricaWestern AsiaWestern EuropeYemenZaireZimbabweAzores
Immigrants from Middle Africa
Race
Ancestry
AfghanAfricanAlaska NativeAlaskan AthabascanAlbanianAleutAlsatianAmericanApacheArabArapahoArgentineanArmenianAssyrian/Chaldean/SyriacAustralianAustrianBahamianBangladeshiBarbadianBasqueBelgianBelizeanBermudanBhutaneseBlackfeetBolivianBrazilianBritishBritish West IndianBulgarianBurmeseCajunCambodianCanadianCape VerdeanCarpatho RusynCelticCentral AmericanCentral American IndianCherokeeCheyenneChickasawChileanChineseChippewaChoctawColombianColvilleComancheCosta RicanCreeCreekCroatianCrowCubanCypriotCzechCzechoslovakianDanishDelawareDominicanDutchDutch West IndianEastern EuropeanEcuadorianEgyptianEnglishEstonianEthiopianEuropeanFijianFilipinoFinnishFrenchFrench American IndianFrench CanadianGermanGerman RussianGhanaianGreekGuamanian/ChamorroGuatemalanGuyaneseHaitianHmongHonduranHopiHoumaHungarianIcelanderIndian (Asian)IndonesianInupiatIranianIraqiIrishIroquoisIsraeliItalianJamaicanJapaneseJordanianKenyanKiowaKoreanLaotianLatvianLebaneseLiberianLithuanianLumbeeLuxembourgerMacedonianMalaysianMalteseMarshalleseMenomineeMexicanMexican American IndianMongolianMoroccanNative HawaiianNavajoNepaleseNew ZealanderNicaraguanNigerianNorthern EuropeanNorwegianOkinawanOsageOttawaPaiutePakistaniPalestinianPanamanianParaguayanPeruvianPimaPolishPortuguesePotawatomiPuebloPuerto RicanPuget Sound SalishRomanianRussianSalvadoranSamoanScandinavianScotch-IrishScottishSeminoleSenegaleseSerbianShoshoneSierra LeoneanSiouxSlavicSlovakSloveneSomaliSouth AfricanSouth AmericanSouth American IndianSoviet UnionSpaniardSpanishSpanish AmericanSpanish American IndianSri LankanSubsaharan AfricanSudaneseSwedishSwissSyrianTaiwaneseThaiTlingit-HaidaTohono O'OdhamTonganTrinidadian and TobagonianTsimshianTurkishU.S. Virgin IslanderUgandanUkrainianUruguayanUteVenezuelanVietnameseWelshWest IndianYakamaYaquiYugoslavianYumanYup'ikZimbabwean
Immigration
NonimmigrantsImmigrantsAfghanistanAfricaAlbaniaArgentinaArmeniaAsiaAustraliaAustriaBahamasBangladeshBarbadosBelarusBelgiumBelizeBoliviaBosnia and HerzegovinaBrazilBulgariaBurma/MyanmarCabo VerdeCambodiaCameroonCanadaCaribbeanCentral AmericaChileChinaColombiaCongoCosta RicaCroatiaCubaCzechoslovakiaDenmarkDominicaDominican RepublicEastern AfricaEastern AsiaEastern EuropeEcuadorEgyptEl SalvadorEnglandEritreaEthiopiaEuropeFijiFranceGermanyGhanaGreeceGrenadaGuatemalaGuyanaHaitiHondurasHong KongHungaryIndiaIndonesiaIranIraqIrelandIsraelItalyJamaicaJapanJordanKazakhstanKenyaKoreaKuwaitLaosLatin AmericaLatviaLebanonLiberiaLithuaniaMalaysiaMexicoMicronesiaMiddle AfricaMoldovaMoroccoNepalNetherlandsNicaraguaNigeriaNorth AmericaNorth MacedoniaNorthern AfricaNorthern EuropeNorwayOceaniaPakistanPanamaPeruPhilippinesPolandPortugalRomaniaRussiaSaudi ArabiaScotlandSenegalSerbiaSierra LeoneSingaporeSomaliaSouth AfricaSouth AmericaSouth Central AsiaSouth Eastern AsiaSouthern EuropeSpainSri LankaSt. Vincent and the GrenadinesSudanSwedenSwitzerlandSyriaTaiwanThailandTrinidad and TobagoTurkeyUgandaUkraineUruguayUzbekistanVenezuelaVietnamWest IndiesWestern AfricaWestern AsiaWestern EuropeYemenZaireZimbabweAzores
Unemployment Among Ages 30 to 34 years
Income
Poverty
Unemployment
Labor Participation
Family Structure
Vehicle Availability
Education Level
Disability

Unemployment Among Ages 30 to 34 years Comparison

Pennsylvania Germans

Immigrants from Middle Africa

Tragic
Excellent
6.3%
UNEMPLOYMENT AMONG AGES 30 TO 34 YEARS
0.0/ 100
METRIC RATING
276th/ 347
METRIC RANK
5.3%
UNEMPLOYMENT AMONG AGES 30 TO 34 YEARS
87.1/ 100
METRIC RATING
108th/ 347
METRIC RANK

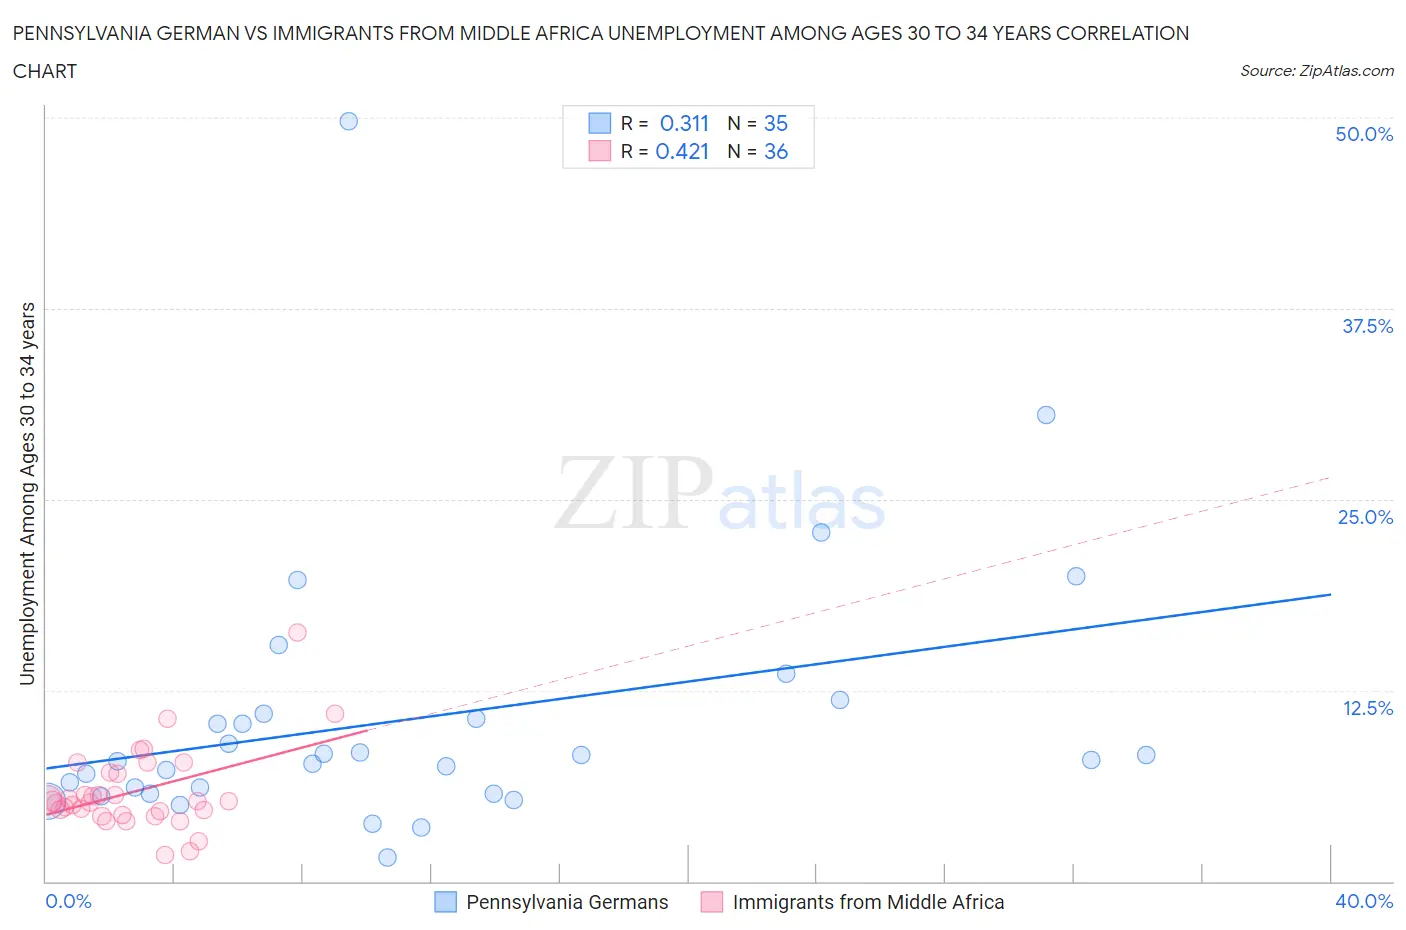
Pennsylvania German vs Immigrants from Middle Africa Unemployment Among Ages 30 to 34 years Correlation Chart

The statistical analysis conducted on geographies consisting of 219,823,756 people shows a mild positive correlation between the proportion of Pennsylvania Germans and unemployment rate among population between the ages 30 and 34 in the United States with a correlation coefficient (R) of 0.311 and weighted average of 6.3%. Similarly, the statistical analysis conducted on geographies consisting of 198,095,532 people shows a moderate positive correlation between the proportion of Immigrants from Middle Africa and unemployment rate among population between the ages 30 and 34 in the United States with a correlation coefficient (R) of 0.421 and weighted average of 5.3%, a difference of 19.1%.
Pennsylvania German vs Immigrants from Middle Africa Unemployment Among Ages 30 to 34 years

Unemployment Among Ages 30 to 34 years Correlation Summary

MeasurementPennsylvania GermanImmigrants from Middle Africa
Minimum1.6%1.7%
Maximum49.8%16.3%
Range48.2%14.6%
Mean10.7%5.9%
Median7.9%5.2%
Interquartile 25% (IQ1)5.8%4.4%
Interquartile 75% (IQ3)11.0%7.0%
Interquartile Range (IQR)5.2%2.6%
Standard Deviation (Sample)9.0%2.7%
Standard Deviation (Population)8.9%2.7%

Similar Demographics by Unemployment Among Ages 30 to 34 years

Demographics Similar to Pennsylvania Germans by Unemployment Among Ages 30 to 34 years

In terms of unemployment among ages 30 to 34 years, the demographic groups most similar to Pennsylvania Germans are Ecuadorian (6.3%, a difference of 0.050%), U.S. Virgin Islander (6.3%, a difference of 0.16%), Ottawa (6.3%, a difference of 0.17%), Blackfeet (6.3%, a difference of 0.18%), and Comanche (6.3%, a difference of 0.29%).
DemographicsRating | RankUnemployment Among Ages 30 to 34 years
French American Indians
0.0
/100
|
#269
Tragic
6.3%
Immigrants | Senegal
0.0
/100
|
#270
Tragic
6.3%
Comanche
0.0
/100
|
#271
Tragic
6.3%
Blackfeet
0.0
/100
|
#272
Tragic
6.3%
Ottawa
0.0
/100
|
#273
Tragic
6.3%
U.S. Virgin Islanders
0.0
/100
|
#274
Tragic
6.3%
Ecuadorians
0.0
/100
|
#275
Tragic
6.3%
Pennsylvania Germans
0.0
/100
|
#276
Tragic
6.3%
Immigrants | Ecuador
0.0
/100
|
#277
Tragic
6.3%
Osage
0.0
/100
|
#278
Tragic
6.3%
Cree
0.0
/100
|
#279
Tragic
6.4%
Cherokee
0.0
/100
|
#280
Tragic
6.4%
Immigrants | Caribbean
0.0
/100
|
#281
Tragic
6.4%
Africans
0.0
/100
|
#282
Tragic
6.4%
Hispanics or Latinos
0.0
/100
|
#283
Tragic
6.4%

Demographics Similar to Immigrants from Middle Africa by Unemployment Among Ages 30 to 34 years

In terms of unemployment among ages 30 to 34 years, the demographic groups most similar to Immigrants from Middle Africa are Icelander (5.3%, a difference of 0.010%), Immigrants from Chile (5.3%, a difference of 0.060%), Croatian (5.3%, a difference of 0.080%), Northern European (5.3%, a difference of 0.12%), and Argentinean (5.3%, a difference of 0.12%).
DemographicsRating | RankUnemployment Among Ages 30 to 34 years
British
89.1
/100
|
#101
Excellent
5.3%
Immigrants | Switzerland
88.8
/100
|
#102
Excellent
5.3%
Immigrants | Jordan
88.8
/100
|
#103
Excellent
5.3%
Northern Europeans
87.9
/100
|
#104
Excellent
5.3%
Argentineans
87.9
/100
|
#105
Excellent
5.3%
Croatians
87.6
/100
|
#106
Excellent
5.3%
Icelanders
87.2
/100
|
#107
Excellent
5.3%
Immigrants | Middle Africa
87.1
/100
|
#108
Excellent
5.3%
Immigrants | Chile
86.7
/100
|
#109
Excellent
5.3%
Egyptians
86.4
/100
|
#110
Excellent
5.3%
Immigrants | Pakistan
86.2
/100
|
#111
Excellent
5.3%
Swiss
85.9
/100
|
#112
Excellent
5.3%
Immigrants | Spain
85.6
/100
|
#113
Excellent
5.3%
Estonians
83.7
/100
|
#114
Excellent
5.3%
Immigrants | Albania
83.4
/100
|
#115
Excellent
5.3%