Paiute vs Scottish Unemployment Among Ages 16 to 19 years
COMPARE
Paiute
Scottish
Unemployment Among Ages 16 to 19 years
Unemployment Among Ages 16 to 19 years Comparison
Paiute
Scottish
24.4%
UNEMPLOYMENT AMONG AGES 16 TO 19 YEARS
0.0/ 100
METRIC RATING
333rd/ 347
METRIC RANK
16.2%
UNEMPLOYMENT AMONG AGES 16 TO 19 YEARS
99.8/ 100
METRIC RATING
35th/ 347
METRIC RANK
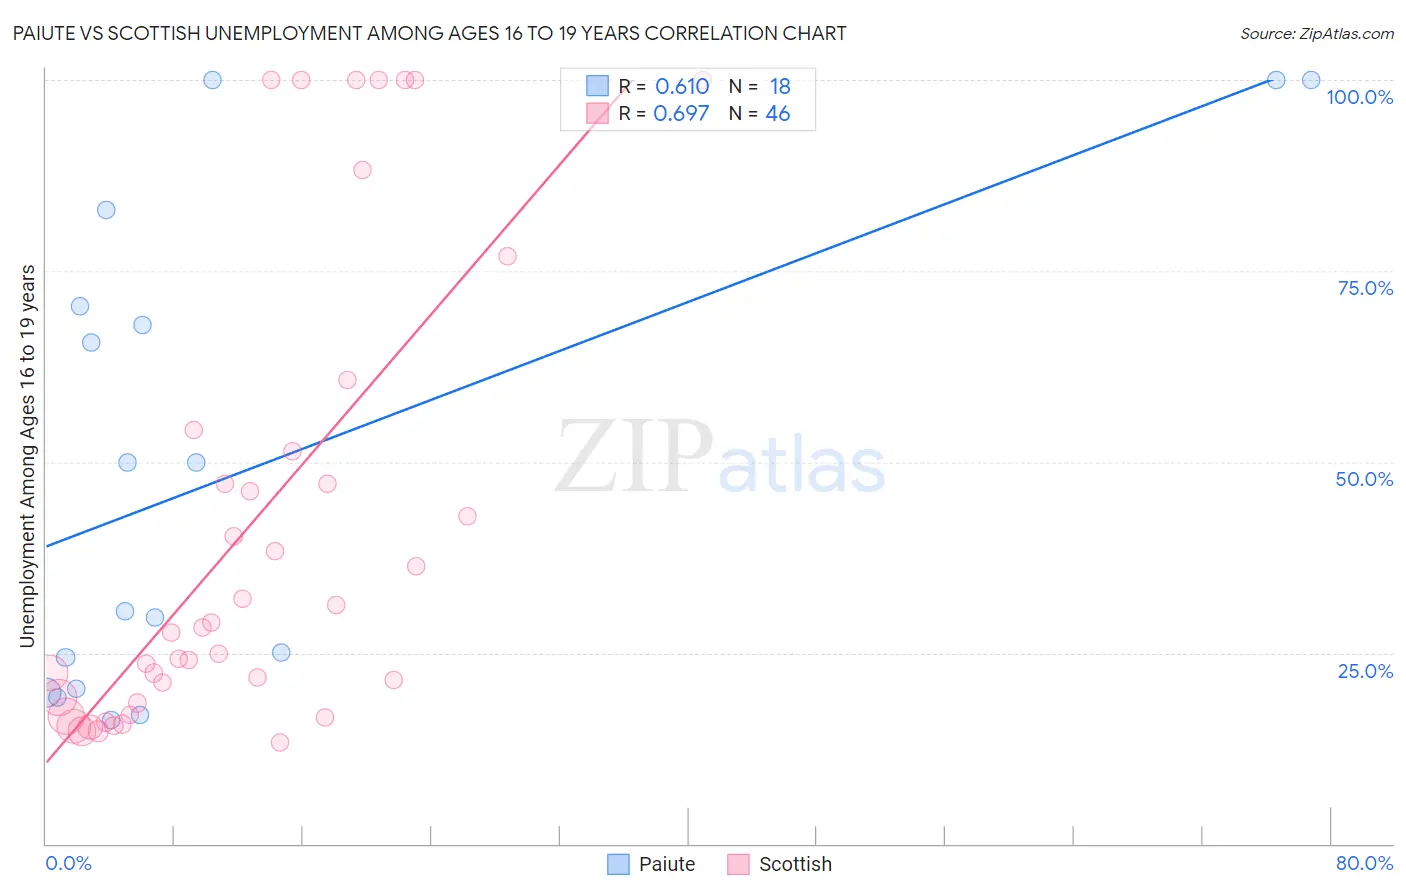
Paiute vs Scottish Unemployment Among Ages 16 to 19 years Correlation Chart
The statistical analysis conducted on geographies consisting of 57,592,055 people shows a significant positive correlation between the proportion of Paiute and unemployment rate among population between the ages 16 and 19 in the United States with a correlation coefficient (R) of 0.610 and weighted average of 24.4%. Similarly, the statistical analysis conducted on geographies consisting of 504,483,132 people shows a significant positive correlation between the proportion of Scottish and unemployment rate among population between the ages 16 and 19 in the United States with a correlation coefficient (R) of 0.697 and weighted average of 16.2%, a difference of 50.0%.
Unemployment Among Ages 16 to 19 years Correlation Summary
| Measurement | Paiute | Scottish |
| Minimum | 16.3% | 13.2% |
| Maximum | 100.0% | 100.0% |
| Range | 83.7% | 86.8% |
| Mean | 49.4% | 41.1% |
| Median | 40.2% | 27.9% |
| Interquartile 25% (IQ1) | 20.3% | 18.4% |
| Interquartile 75% (IQ3) | 70.4% | 51.4% |
| Interquartile Range (IQR) | 50.0% | 33.0% |
| Standard Deviation (Sample) | 31.3% | 30.0% |
| Standard Deviation (Population) | 30.4% | 29.7% |
Similar Demographics by Unemployment Among Ages 16 to 19 years
Demographics Similar to Paiute by Unemployment Among Ages 16 to 19 years
In terms of unemployment among ages 16 to 19 years, the demographic groups most similar to Paiute are Immigrants from Barbados (24.0%, a difference of 1.4%), British West Indian (24.0%, a difference of 1.6%), Guyanese (24.8%, a difference of 1.9%), Dominican (23.6%, a difference of 3.0%), and Arapaho (25.2%, a difference of 3.3%).
| Demographics | Rating | Rank | Unemployment Among Ages 16 to 19 years |
| Immigrants | Trinidad and Tobago | 0.0 /100 | #326 | Tragic 23.1% |
| Pima | 0.0 /100 | #327 | Tragic 23.1% |
| Immigrants | Dominican Republic | 0.0 /100 | #328 | Tragic 23.3% |
| Tlingit-Haida | 0.0 /100 | #329 | Tragic 23.5% |
| Dominicans | 0.0 /100 | #330 | Tragic 23.6% |
| British West Indians | 0.0 /100 | #331 | Tragic 24.0% |
| Immigrants | Barbados | 0.0 /100 | #332 | Tragic 24.0% |
| Paiute | 0.0 /100 | #333 | Tragic 24.4% |
| Guyanese | 0.0 /100 | #334 | Tragic 24.8% |
| Arapaho | 0.0 /100 | #335 | Tragic 25.2% |
| Kiowa | 0.0 /100 | #336 | Tragic 25.2% |
| Immigrants | Guyana | 0.0 /100 | #337 | Tragic 25.5% |
| Immigrants | St. Vincent and the Grenadines | 0.0 /100 | #338 | Tragic 25.7% |
| Immigrants | Grenada | 0.0 /100 | #339 | Tragic 25.7% |
| Crow | 0.0 /100 | #340 | Tragic 26.2% |
Demographics Similar to Scottish by Unemployment Among Ages 16 to 19 years
In terms of unemployment among ages 16 to 19 years, the demographic groups most similar to Scottish are Immigrants from South Central Asia (16.2%, a difference of 0.010%), Immigrants from Congo (16.3%, a difference of 0.12%), Bulgarian (16.3%, a difference of 0.13%), Pennsylvania German (16.2%, a difference of 0.15%), and Immigrants from Kenya (16.2%, a difference of 0.18%).
| Demographics | Rating | Rank | Unemployment Among Ages 16 to 19 years |
| Jordanians | 99.9 /100 | #28 | Exceptional 16.0% |
| Chinese | 99.9 /100 | #29 | Exceptional 16.0% |
| Kenyans | 99.9 /100 | #30 | Exceptional 16.1% |
| English | 99.9 /100 | #31 | Exceptional 16.1% |
| Europeans | 99.9 /100 | #32 | Exceptional 16.1% |
| Immigrants | Kenya | 99.9 /100 | #33 | Exceptional 16.2% |
| Pennsylvania Germans | 99.9 /100 | #34 | Exceptional 16.2% |
| Scottish | 99.8 /100 | #35 | Exceptional 16.2% |
| Immigrants | South Central Asia | 99.8 /100 | #36 | Exceptional 16.2% |
| Immigrants | Congo | 99.8 /100 | #37 | Exceptional 16.3% |
| Bulgarians | 99.8 /100 | #38 | Exceptional 16.3% |
| Croatians | 99.8 /100 | #39 | Exceptional 16.3% |
| Hmong | 99.8 /100 | #40 | Exceptional 16.3% |
| Immigrants | Nepal | 99.8 /100 | #41 | Exceptional 16.3% |
| Fijians | 99.8 /100 | #42 | Exceptional 16.3% |