Immigrants from Peru vs Immigrants from Norway Unemployment Among Women with Children Under 6 years
COMPARE
Immigrants from Peru
Immigrants from Norway
Unemployment Among Women with Children Under 6 years
Unemployment Among Women with Children Under 6 years Comparison
Immigrants from Peru
Immigrants from Norway
7.5%
UNEMPLOYMENT AMONG WOMEN WITH CHILDREN UNDER 6 YEARS
74.9/ 100
METRIC RATING
151st/ 347
METRIC RANK
7.4%
UNEMPLOYMENT AMONG WOMEN WITH CHILDREN UNDER 6 YEARS
84.1/ 100
METRIC RATING
138th/ 347
METRIC RANK
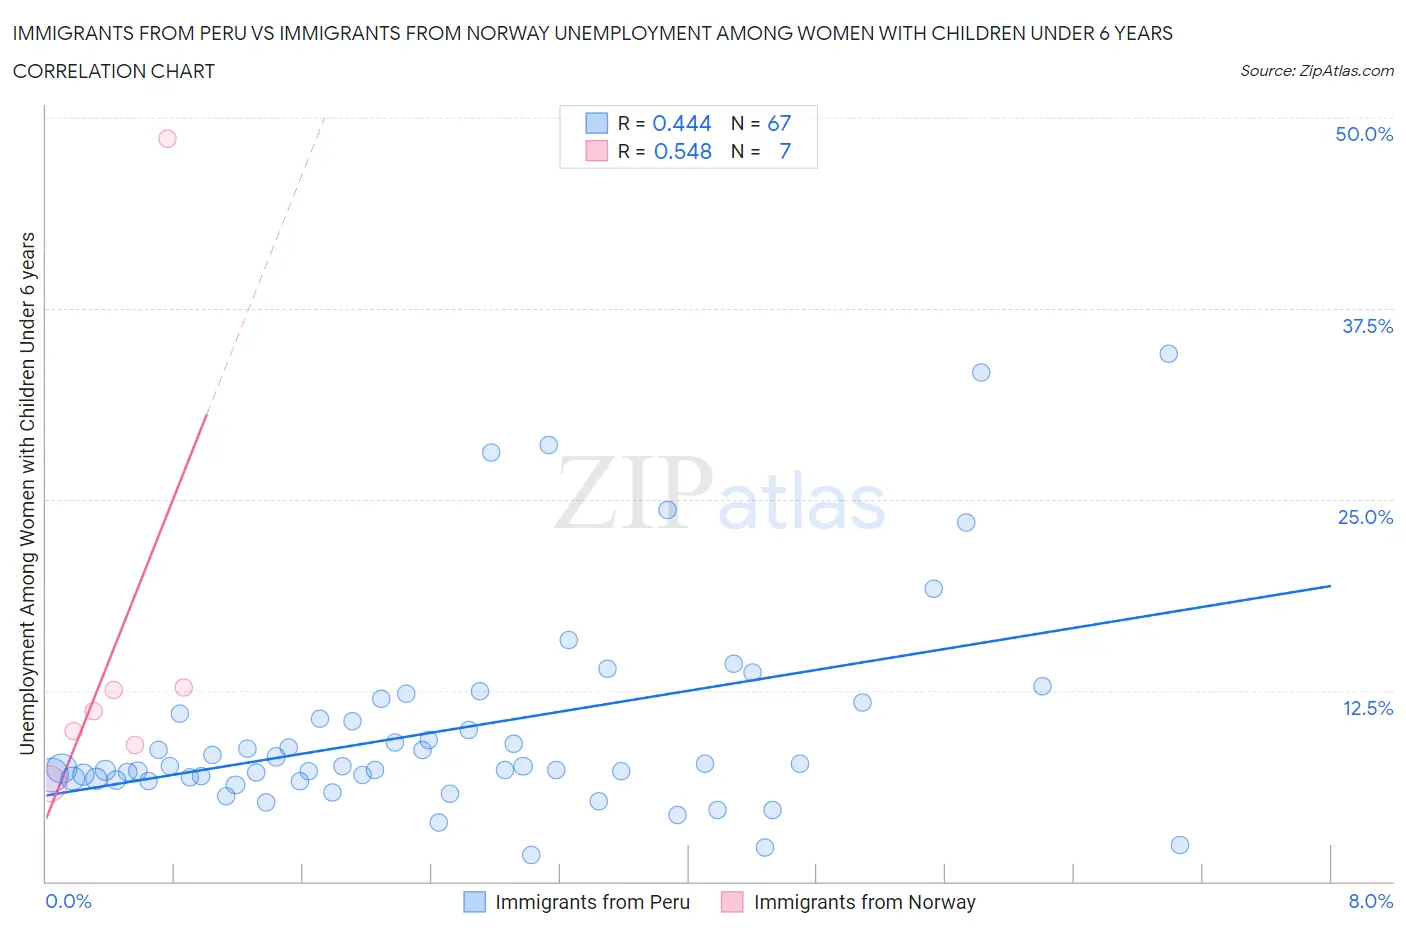
Immigrants from Peru vs Immigrants from Norway Unemployment Among Women with Children Under 6 years Correlation Chart
The statistical analysis conducted on geographies consisting of 264,130,513 people shows a moderate positive correlation between the proportion of Immigrants from Peru and unemployment rate among women with children under the age of 6 in the United States with a correlation coefficient (R) of 0.444 and weighted average of 7.5%. Similarly, the statistical analysis conducted on geographies consisting of 101,007,558 people shows a substantial positive correlation between the proportion of Immigrants from Norway and unemployment rate among women with children under the age of 6 in the United States with a correlation coefficient (R) of 0.548 and weighted average of 7.4%, a difference of 0.97%.
Unemployment Among Women with Children Under 6 years Correlation Summary
| Measurement | Immigrants from Peru | Immigrants from Norway |
| Minimum | 1.7% | 6.4% |
| Maximum | 34.5% | 48.6% |
| Range | 32.8% | 42.2% |
| Mean | 9.9% | 15.7% |
| Median | 7.5% | 11.1% |
| Interquartile 25% (IQ1) | 6.7% | 8.9% |
| Interquartile 75% (IQ3) | 11.0% | 12.7% |
| Interquartile Range (IQR) | 4.3% | 3.8% |
| Standard Deviation (Sample) | 6.8% | 14.7% |
| Standard Deviation (Population) | 6.7% | 13.6% |
Demographics Similar to Immigrants from Peru and Immigrants from Norway by Unemployment Among Women with Children Under 6 years
In terms of unemployment among women with children under 6 years, the demographic groups most similar to Immigrants from Peru are Bangladeshi (7.5%, a difference of 0.010%), Uruguayan (7.5%, a difference of 0.020%), Northern European (7.5%, a difference of 0.050%), Aleut (7.5%, a difference of 0.10%), and Colombian (7.5%, a difference of 0.11%). Similarly, the demographic groups most similar to Immigrants from Norway are Immigrants from Colombia (7.4%, a difference of 0.020%), Immigrants from Cambodia (7.4%, a difference of 0.070%), Immigrants from Morocco (7.4%, a difference of 0.11%), Scandinavian (7.4%, a difference of 0.13%), and Immigrants from Northern Africa (7.4%, a difference of 0.17%).
| Demographics | Rating | Rank | Unemployment Among Women with Children Under 6 years |
| Immigrants | Bolivia | 85.7 /100 | #134 | Excellent 7.4% |
| Immigrants | Northern Africa | 85.3 /100 | #135 | Excellent 7.4% |
| Immigrants | Morocco | 84.9 /100 | #136 | Excellent 7.4% |
| Immigrants | Cambodia | 84.6 /100 | #137 | Excellent 7.4% |
| Immigrants | Norway | 84.1 /100 | #138 | Excellent 7.4% |
| Immigrants | Colombia | 83.9 /100 | #139 | Excellent 7.4% |
| Scandinavians | 83.0 /100 | #140 | Excellent 7.4% |
| Greeks | 82.6 /100 | #141 | Excellent 7.4% |
| Immigrants | Argentina | 81.5 /100 | #142 | Excellent 7.5% |
| Koreans | 81.3 /100 | #143 | Excellent 7.5% |
| Europeans | 79.1 /100 | #144 | Good 7.5% |
| Immigrants | Jordan | 78.9 /100 | #145 | Good 7.5% |
| Japanese | 78.9 /100 | #146 | Good 7.5% |
| Immigrants | Oceania | 78.4 /100 | #147 | Good 7.5% |
| Immigrants | Brazil | 77.3 /100 | #148 | Good 7.5% |
| Colombians | 76.1 /100 | #149 | Good 7.5% |
| Aleuts | 76.0 /100 | #150 | Good 7.5% |
| Immigrants | Peru | 74.9 /100 | #151 | Good 7.5% |
| Bangladeshis | 74.8 /100 | #152 | Good 7.5% |
| Uruguayans | 74.7 /100 | #153 | Good 7.5% |
| Northern Europeans | 74.3 /100 | #154 | Good 7.5% |