Ottawa vs Bahamian Male Unemployment
COMPARE
Ottawa
Bahamian
Male Unemployment
Male Unemployment Comparison
Ottawa
Bahamians
5.7%
MALE UNEMPLOYMENT
0.9/ 100
METRIC RATING
242nd/ 347
METRIC RANK
5.9%
MALE UNEMPLOYMENT
0.0/ 100
METRIC RATING
266th/ 347
METRIC RANK
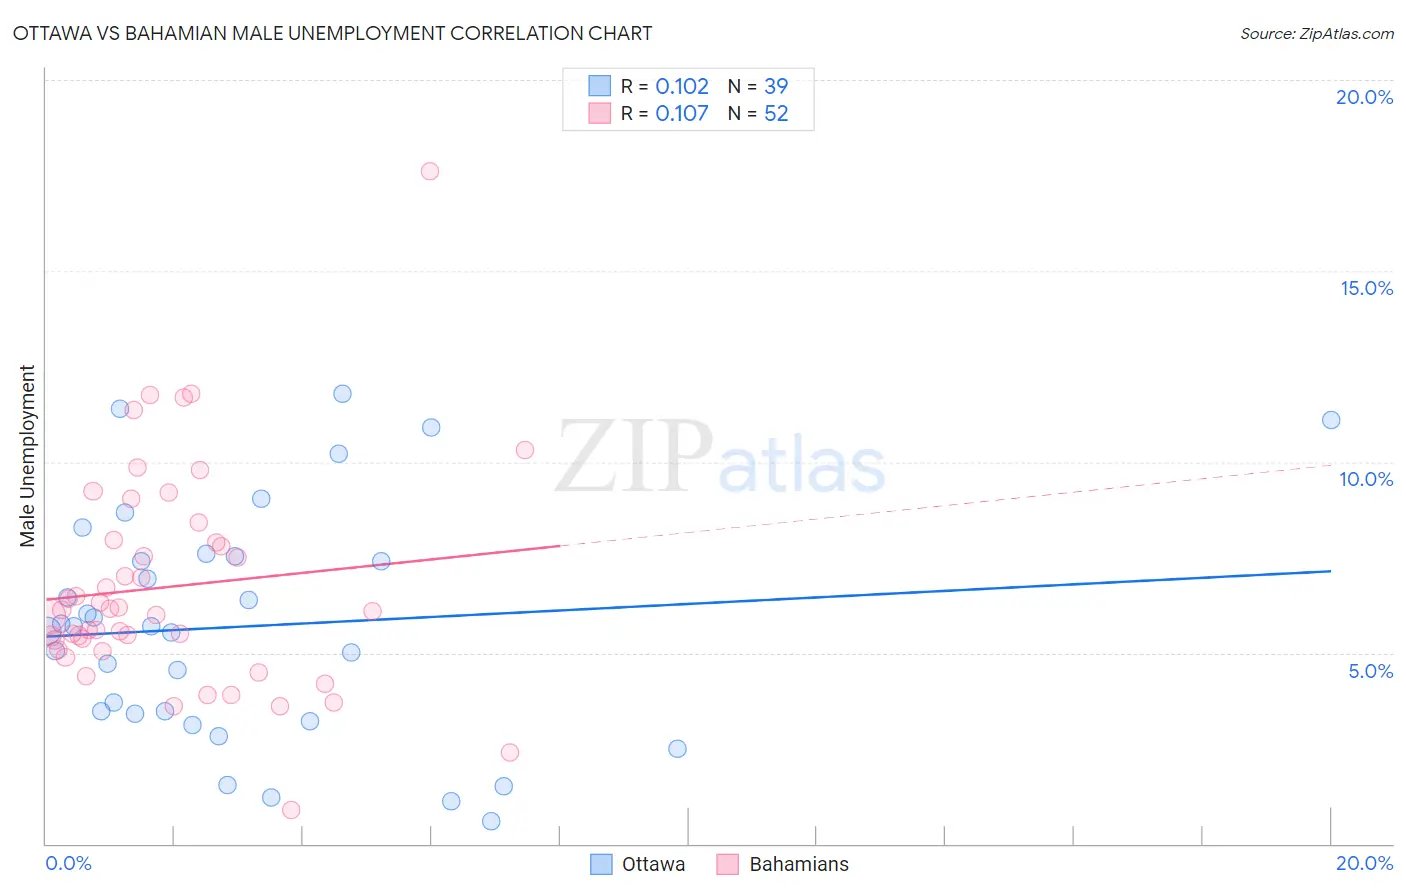
Ottawa vs Bahamian Male Unemployment Correlation Chart
The statistical analysis conducted on geographies consisting of 49,911,932 people shows a poor positive correlation between the proportion of Ottawa and unemployment rate among males in the United States with a correlation coefficient (R) of 0.102 and weighted average of 5.7%. Similarly, the statistical analysis conducted on geographies consisting of 112,565,011 people shows a poor positive correlation between the proportion of Bahamians and unemployment rate among males in the United States with a correlation coefficient (R) of 0.107 and weighted average of 5.9%, a difference of 4.6%.
Male Unemployment Correlation Summary
| Measurement | Ottawa | Bahamian |
| Minimum | 0.60% | 0.90% |
| Maximum | 11.8% | 17.6% |
| Range | 11.2% | 16.7% |
| Mean | 5.7% | 6.7% |
| Median | 5.7% | 6.1% |
| Interquartile 25% (IQ1) | 3.4% | 5.2% |
| Interquartile 75% (IQ3) | 7.5% | 7.9% |
| Interquartile Range (IQR) | 4.1% | 2.7% |
| Standard Deviation (Sample) | 3.0% | 2.9% |
| Standard Deviation (Population) | 3.0% | 2.8% |
Similar Demographics by Male Unemployment
Demographics Similar to Ottawa by Male Unemployment
In terms of male unemployment, the demographic groups most similar to Ottawa are Salvadoran (5.7%, a difference of 0.070%), Immigrants from Cameroon (5.6%, a difference of 0.11%), Immigrants from Guatemala (5.6%, a difference of 0.18%), Native Hawaiian (5.6%, a difference of 0.19%), and Honduran (5.6%, a difference of 0.23%).
| Demographics | Rating | Rank | Male Unemployment |
| Immigrants | Honduras | 1.5 /100 | #235 | Tragic 5.6% |
| Guatemalans | 1.2 /100 | #236 | Tragic 5.6% |
| Hondurans | 1.1 /100 | #237 | Tragic 5.6% |
| Native Hawaiians | 1.1 /100 | #238 | Tragic 5.6% |
| Immigrants | Guatemala | 1.1 /100 | #239 | Tragic 5.6% |
| Immigrants | Cameroon | 1.0 /100 | #240 | Tragic 5.6% |
| Salvadorans | 1.0 /100 | #241 | Tragic 5.7% |
| Ottawa | 0.9 /100 | #242 | Tragic 5.7% |
| Bangladeshis | 0.8 /100 | #243 | Tragic 5.7% |
| Immigrants | El Salvador | 0.7 /100 | #244 | Tragic 5.7% |
| Yaqui | 0.7 /100 | #245 | Tragic 5.7% |
| Iroquois | 0.6 /100 | #246 | Tragic 5.7% |
| Hawaiians | 0.6 /100 | #247 | Tragic 5.7% |
| Marshallese | 0.5 /100 | #248 | Tragic 5.7% |
| Cree | 0.4 /100 | #249 | Tragic 5.7% |
Demographics Similar to Bahamians by Male Unemployment
In terms of male unemployment, the demographic groups most similar to Bahamians are Nigerian (5.9%, a difference of 0.12%), French American Indian (5.9%, a difference of 0.14%), Bermudan (5.9%, a difference of 0.33%), Immigrants from Mexico (5.9%, a difference of 0.52%), and Immigrants from Nigeria (6.0%, a difference of 0.60%).
| Demographics | Rating | Rank | Male Unemployment |
| Cajuns | 0.1 /100 | #259 | Tragic 5.8% |
| Immigrants | Central America | 0.1 /100 | #260 | Tragic 5.8% |
| Liberians | 0.1 /100 | #261 | Tragic 5.8% |
| Immigrants | Portugal | 0.1 /100 | #262 | Tragic 5.9% |
| Immigrants | Latin America | 0.1 /100 | #263 | Tragic 5.9% |
| Immigrants | Mexico | 0.0 /100 | #264 | Tragic 5.9% |
| French American Indians | 0.0 /100 | #265 | Tragic 5.9% |
| Bahamians | 0.0 /100 | #266 | Tragic 5.9% |
| Nigerians | 0.0 /100 | #267 | Tragic 5.9% |
| Bermudans | 0.0 /100 | #268 | Tragic 5.9% |
| Immigrants | Nigeria | 0.0 /100 | #269 | Tragic 6.0% |
| Sub-Saharan Africans | 0.0 /100 | #270 | Tragic 6.0% |
| Blackfeet | 0.0 /100 | #271 | Tragic 6.0% |
| Immigrants | Uzbekistan | 0.0 /100 | #272 | Tragic 6.0% |
| Armenians | 0.0 /100 | #273 | Tragic 6.0% |