Ottawa vs Black/African American Unemployment Among Ages 45 to 54 years
COMPARE
Ottawa
Black/African American
Unemployment Among Ages 45 to 54 years
Unemployment Among Ages 45 to 54 years Comparison
Ottawa
Blacks/African Americans
4.7%
UNEMPLOYMENT AMONG AGES 45 TO 54 YEARS
2.7/ 100
METRIC RATING
232nd/ 347
METRIC RANK
5.4%
UNEMPLOYMENT AMONG AGES 45 TO 54 YEARS
0.0/ 100
METRIC RATING
308th/ 347
METRIC RANK
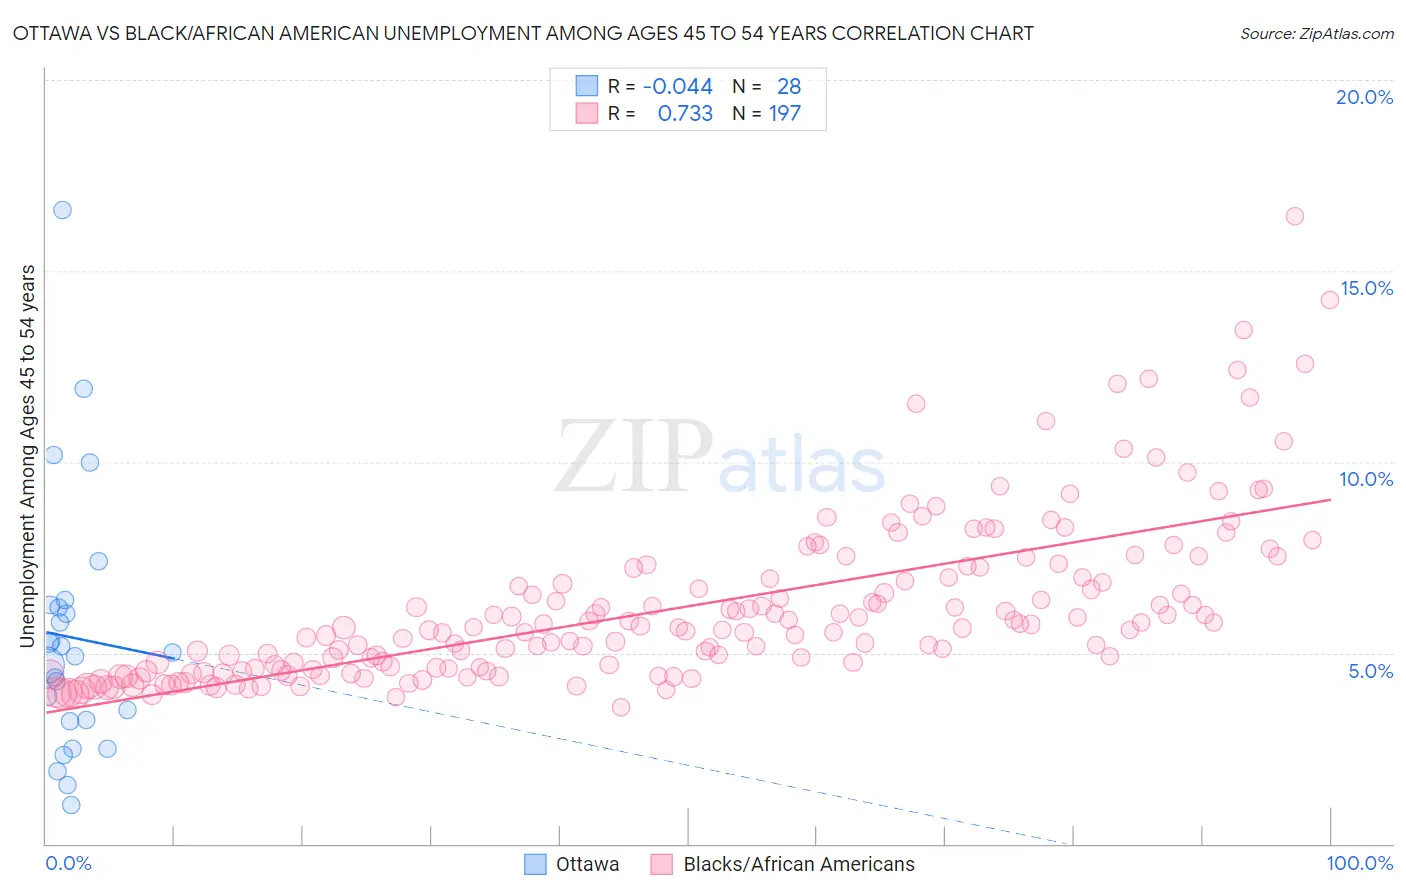
Ottawa vs Black/African American Unemployment Among Ages 45 to 54 years Correlation Chart
The statistical analysis conducted on geographies consisting of 49,375,752 people shows no correlation between the proportion of Ottawa and unemployment rate among population between the ages 45 and 54 in the United States with a correlation coefficient (R) of -0.044 and weighted average of 4.7%. Similarly, the statistical analysis conducted on geographies consisting of 527,917,947 people shows a strong positive correlation between the proportion of Blacks/African Americans and unemployment rate among population between the ages 45 and 54 in the United States with a correlation coefficient (R) of 0.733 and weighted average of 5.4%, a difference of 15.2%.
Unemployment Among Ages 45 to 54 years Correlation Summary
| Measurement | Ottawa | Black/African American |
| Minimum | 1.0% | 3.6% |
| Maximum | 16.6% | 16.4% |
| Range | 15.6% | 12.9% |
| Mean | 5.4% | 6.2% |
| Median | 5.0% | 5.6% |
| Interquartile 25% (IQ1) | 3.2% | 4.6% |
| Interquartile 75% (IQ3) | 6.2% | 7.0% |
| Interquartile Range (IQR) | 3.0% | 2.4% |
| Standard Deviation (Sample) | 3.4% | 2.2% |
| Standard Deviation (Population) | 3.3% | 2.2% |
Similar Demographics by Unemployment Among Ages 45 to 54 years
Demographics Similar to Ottawa by Unemployment Among Ages 45 to 54 years
In terms of unemployment among ages 45 to 54 years, the demographic groups most similar to Ottawa are Immigrants from Ireland (4.7%, a difference of 0.010%), Japanese (4.7%, a difference of 0.040%), Immigrants (4.7%, a difference of 0.040%), Soviet Union (4.7%, a difference of 0.060%), and Immigrants from Israel (4.7%, a difference of 0.12%).
| Demographics | Rating | Rank | Unemployment Among Ages 45 to 54 years |
| Immigrants | Norway | 4.8 /100 | #225 | Tragic 4.7% |
| Assyrians/Chaldeans/Syriacs | 3.5 /100 | #226 | Tragic 4.7% |
| Iraqis | 3.2 /100 | #227 | Tragic 4.7% |
| South American Indians | 3.1 /100 | #228 | Tragic 4.7% |
| Immigrants | Israel | 3.0 /100 | #229 | Tragic 4.7% |
| Japanese | 2.8 /100 | #230 | Tragic 4.7% |
| Immigrants | Ireland | 2.7 /100 | #231 | Tragic 4.7% |
| Ottawa | 2.7 /100 | #232 | Tragic 4.7% |
| Immigrants | Immigrants | 2.6 /100 | #233 | Tragic 4.7% |
| Soviet Union | 2.6 /100 | #234 | Tragic 4.7% |
| Cree | 2.3 /100 | #235 | Tragic 4.7% |
| Tlingit-Haida | 2.3 /100 | #236 | Tragic 4.7% |
| Alsatians | 1.6 /100 | #237 | Tragic 4.7% |
| Yaqui | 1.4 /100 | #238 | Tragic 4.7% |
| Spanish Americans | 1.4 /100 | #239 | Tragic 4.7% |
Demographics Similar to Blacks/African Americans by Unemployment Among Ages 45 to 54 years
In terms of unemployment among ages 45 to 54 years, the demographic groups most similar to Blacks/African Americans are Barbadian (5.5%, a difference of 0.65%), Vietnamese (5.4%, a difference of 0.76%), Immigrants from Barbados (5.5%, a difference of 0.80%), Immigrants from Bangladesh (5.4%, a difference of 1.0%), and Chippewa (5.5%, a difference of 1.1%).
| Demographics | Rating | Rank | Unemployment Among Ages 45 to 54 years |
| Menominee | 0.0 /100 | #301 | Tragic 5.3% |
| Immigrants | Ecuador | 0.0 /100 | #302 | Tragic 5.3% |
| Immigrants | Belize | 0.0 /100 | #303 | Tragic 5.3% |
| Immigrants | Jamaica | 0.0 /100 | #304 | Tragic 5.4% |
| Immigrants | West Indies | 0.0 /100 | #305 | Tragic 5.4% |
| Immigrants | Bangladesh | 0.0 /100 | #306 | Tragic 5.4% |
| Vietnamese | 0.0 /100 | #307 | Tragic 5.4% |
| Blacks/African Americans | 0.0 /100 | #308 | Tragic 5.4% |
| Barbadians | 0.0 /100 | #309 | Tragic 5.5% |
| Immigrants | Barbados | 0.0 /100 | #310 | Tragic 5.5% |
| Chippewa | 0.0 /100 | #311 | Tragic 5.5% |
| Immigrants | Grenada | 0.0 /100 | #312 | Tragic 5.6% |
| Shoshone | 0.0 /100 | #313 | Tragic 5.6% |
| Guyanese | 0.0 /100 | #314 | Tragic 5.6% |
| Immigrants | Dominica | 0.0 /100 | #315 | Tragic 5.6% |