Immigrants from Czechoslovakia vs Black/African American Unemployment Among Ages 35 to 44 years
COMPARE
Immigrants from Czechoslovakia
Black/African American
Unemployment Among Ages 35 to 44 years
Unemployment Among Ages 35 to 44 years Comparison
Immigrants from Czechoslovakia
Blacks/African Americans
4.5%
UNEMPLOYMENT AMONG AGES 35 TO 44 YEARS
89.2/ 100
METRIC RATING
112th/ 347
METRIC RANK
6.1%
UNEMPLOYMENT AMONG AGES 35 TO 44 YEARS
0.0/ 100
METRIC RATING
315th/ 347
METRIC RANK
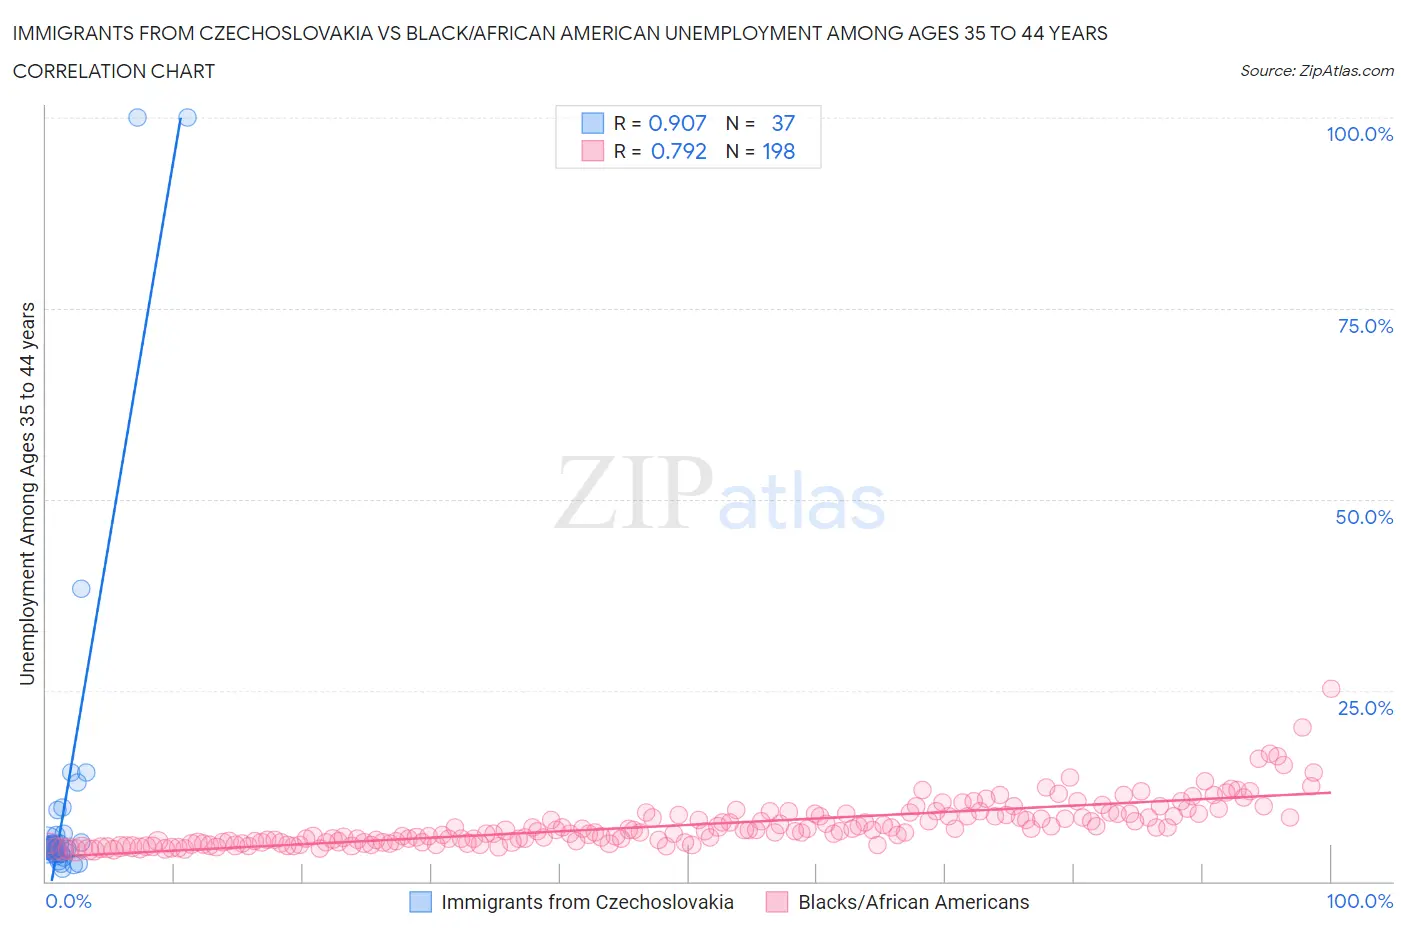
Immigrants from Czechoslovakia vs Black/African American Unemployment Among Ages 35 to 44 years Correlation Chart
The statistical analysis conducted on geographies consisting of 193,308,245 people shows a near-perfect positive correlation between the proportion of Immigrants from Czechoslovakia and unemployment rate among population between the ages 35 and 44 in the United States with a correlation coefficient (R) of 0.907 and weighted average of 4.5%. Similarly, the statistical analysis conducted on geographies consisting of 531,599,324 people shows a strong positive correlation between the proportion of Blacks/African Americans and unemployment rate among population between the ages 35 and 44 in the United States with a correlation coefficient (R) of 0.792 and weighted average of 6.1%, a difference of 35.2%.
Unemployment Among Ages 35 to 44 years Correlation Summary
| Measurement | Immigrants from Czechoslovakia | Black/African American |
| Minimum | 1.7% | 4.1% |
| Maximum | 100.0% | 25.2% |
| Range | 98.3% | 21.1% |
| Mean | 11.2% | 7.4% |
| Median | 4.4% | 6.6% |
| Interquartile 25% (IQ1) | 3.6% | 5.1% |
| Interquartile 75% (IQ3) | 6.2% | 8.7% |
| Interquartile Range (IQR) | 2.6% | 3.6% |
| Standard Deviation (Sample) | 22.4% | 3.1% |
| Standard Deviation (Population) | 22.1% | 3.0% |
Similar Demographics by Unemployment Among Ages 35 to 44 years
Demographics Similar to Immigrants from Czechoslovakia by Unemployment Among Ages 35 to 44 years
In terms of unemployment among ages 35 to 44 years, the demographic groups most similar to Immigrants from Czechoslovakia are Immigrants from Nicaragua (4.5%, a difference of 0.13%), Immigrants from Italy (4.5%, a difference of 0.15%), Immigrants from Kazakhstan (4.5%, a difference of 0.16%), Macedonian (4.5%, a difference of 0.17%), and Maltese (4.5%, a difference of 0.19%).
| Demographics | Rating | Rank | Unemployment Among Ages 35 to 44 years |
| Immigrants | Saudi Arabia | 91.3 /100 | #105 | Exceptional 4.5% |
| Immigrants | North America | 91.1 /100 | #106 | Exceptional 4.5% |
| Immigrants | North Macedonia | 90.7 /100 | #107 | Exceptional 4.5% |
| New Zealanders | 90.3 /100 | #108 | Exceptional 4.5% |
| Romanians | 90.3 /100 | #109 | Exceptional 4.5% |
| Immigrants | Kazakhstan | 90.0 /100 | #110 | Excellent 4.5% |
| Immigrants | Nicaragua | 89.8 /100 | #111 | Excellent 4.5% |
| Immigrants | Czechoslovakia | 89.2 /100 | #112 | Excellent 4.5% |
| Immigrants | Italy | 88.4 /100 | #113 | Excellent 4.5% |
| Macedonians | 88.3 /100 | #114 | Excellent 4.5% |
| Maltese | 88.1 /100 | #115 | Excellent 4.5% |
| Immigrants | Israel | 88.1 /100 | #116 | Excellent 4.5% |
| Immigrants | Greece | 87.9 /100 | #117 | Excellent 4.5% |
| Irish | 87.9 /100 | #118 | Excellent 4.5% |
| Nicaraguans | 87.6 /100 | #119 | Excellent 4.5% |
Demographics Similar to Blacks/African Americans by Unemployment Among Ages 35 to 44 years
In terms of unemployment among ages 35 to 44 years, the demographic groups most similar to Blacks/African Americans are Tsimshian (6.2%, a difference of 0.85%), Immigrants from St. Vincent and the Grenadines (6.2%, a difference of 1.0%), Colville (6.2%, a difference of 1.5%), Immigrants from Grenada (6.2%, a difference of 1.7%), and Immigrants from Dominica (6.0%, a difference of 1.8%).
| Demographics | Rating | Rank | Unemployment Among Ages 35 to 44 years |
| Immigrants | Azores | 0.0 /100 | #308 | Tragic 5.8% |
| Immigrants | Barbados | 0.0 /100 | #309 | Tragic 5.8% |
| Guyanese | 0.0 /100 | #310 | Tragic 5.9% |
| Marshallese | 0.0 /100 | #311 | Tragic 5.9% |
| Immigrants | Guyana | 0.0 /100 | #312 | Tragic 6.0% |
| British West Indians | 0.0 /100 | #313 | Tragic 6.0% |
| Immigrants | Dominica | 0.0 /100 | #314 | Tragic 6.0% |
| Blacks/African Americans | 0.0 /100 | #315 | Tragic 6.1% |
| Tsimshian | 0.0 /100 | #316 | Tragic 6.2% |
| Immigrants | St. Vincent and the Grenadines | 0.0 /100 | #317 | Tragic 6.2% |
| Colville | 0.0 /100 | #318 | Tragic 6.2% |
| Immigrants | Grenada | 0.0 /100 | #319 | Tragic 6.2% |
| Immigrants | Armenia | 0.0 /100 | #320 | Tragic 6.2% |
| Chippewa | 0.0 /100 | #321 | Tragic 6.2% |
| Immigrants | Dominican Republic | 0.0 /100 | #322 | Tragic 6.4% |