Spanish vs Paiute Unemployment

COMPARE

Spanish
Race
Ancestry
AfghanAfricanAlaska NativeAlaskan AthabascanAlbanianAleutAlsatianAmericanApacheArabArapahoArgentineanArmenianAssyrian/Chaldean/SyriacAustralianAustrianBahamianBangladeshiBarbadianBasqueBelgianBelizeanBermudanBhutaneseBlackfeetBolivianBrazilianBritishBritish West IndianBulgarianBurmeseCajunCambodianCanadianCape VerdeanCarpatho RusynCelticCentral AmericanCentral American IndianCherokeeCheyenneChickasawChileanChineseChippewaChoctawColombianColvilleComancheCosta RicanCreeCreekCroatianCrowCubanCypriotCzechCzechoslovakianDanishDelawareDominicanDutchDutch West IndianEastern EuropeanEcuadorianEgyptianEnglishEstonianEthiopianEuropeanFijianFilipinoFinnishFrenchFrench American IndianFrench CanadianGermanGerman RussianGhanaianGreekGuamanian/ChamorroGuatemalanGuyaneseHaitianHmongHonduranHopiHoumaHungarianIcelanderIndian (Asian)IndonesianInupiatIranianIraqiIrishIroquoisIsraeliItalianJamaicanJapaneseJordanianKenyanKiowaKoreanLaotianLatvianLebaneseLiberianLithuanianLumbeeLuxembourgerMacedonianMalaysianMalteseMarshalleseMenomineeMexicanMexican American IndianMongolianMoroccanNative HawaiianNavajoNepaleseNew ZealanderNicaraguanNigerianNorthern EuropeanNorwegianOkinawanOsageOttawaPakistaniPalestinianPanamanianParaguayanPennsylvania GermanPeruvianPimaPolishPortuguesePotawatomiPuebloPuerto RicanPuget Sound SalishRomanianRussianSalvadoranSamoanScandinavianScotch-IrishScottishSeminoleSenegaleseSerbianShoshoneSierra LeoneanSiouxSlavicSlovakSloveneSomaliSouth AfricanSouth AmericanSouth American IndianSoviet UnionSpaniardSpanishSpanish AmericanSpanish American IndianSri LankanSubsaharan AfricanSudaneseSwedishSwissSyrianTaiwaneseThaiTlingit-HaidaTohono O'OdhamTonganTrinidadian and TobagonianTsimshianTurkishU.S. Virgin IslanderUgandanUkrainianUruguayanUteVenezuelanVietnameseWelshWest IndianYakamaYaquiYugoslavianYumanYup'ikZimbabwean
Immigration
NonimmigrantsImmigrantsAfghanistanAfricaAlbaniaArgentinaArmeniaAsiaAustraliaAustriaBahamasBangladeshBarbadosBelarusBelgiumBelizeBoliviaBosnia and HerzegovinaBrazilBulgariaBurma/MyanmarCabo VerdeCambodiaCameroonCanadaCaribbeanCentral AmericaChileChinaColombiaCongoCosta RicaCroatiaCubaCzechoslovakiaDenmarkDominicaDominican RepublicEastern AfricaEastern AsiaEastern EuropeEcuadorEgyptEl SalvadorEnglandEritreaEthiopiaEuropeFijiFranceGermanyGhanaGreeceGrenadaGuatemalaGuyanaHaitiHondurasHong KongHungaryIndiaIndonesiaIranIraqIrelandIsraelItalyJamaicaJapanJordanKazakhstanKenyaKoreaKuwaitLaosLatin AmericaLatviaLebanonLiberiaLithuaniaMalaysiaMexicoMicronesiaMiddle AfricaMoldovaMoroccoNepalNetherlandsNicaraguaNigeriaNorth AmericaNorth MacedoniaNorthern AfricaNorthern EuropeNorwayOceaniaPakistanPanamaPeruPhilippinesPolandPortugalRomaniaRussiaSaudi ArabiaScotlandSenegalSerbiaSierra LeoneSingaporeSomaliaSouth AfricaSouth AmericaSouth Central AsiaSouth Eastern AsiaSouthern EuropeSpainSri LankaSt. Vincent and the GrenadinesSudanSwedenSwitzerlandSyriaTaiwanThailandTrinidad and TobagoTurkeyUgandaUkraineUruguayUzbekistanVenezuelaVietnamWest IndiesWestern AfricaWestern AsiaWestern EuropeYemenZaireZimbabweAzores
Paiute
Race
Ancestry
AfghanAfricanAlaska NativeAlaskan AthabascanAlbanianAleutAlsatianAmericanApacheArabArapahoArgentineanArmenianAssyrian/Chaldean/SyriacAustralianAustrianBahamianBangladeshiBarbadianBasqueBelgianBelizeanBermudanBhutaneseBlackfeetBolivianBrazilianBritishBritish West IndianBulgarianBurmeseCajunCambodianCanadianCape VerdeanCarpatho RusynCelticCentral AmericanCentral American IndianCherokeeCheyenneChickasawChileanChineseChippewaChoctawColombianColvilleComancheCosta RicanCreeCreekCroatianCrowCubanCypriotCzechCzechoslovakianDanishDelawareDominicanDutchDutch West IndianEastern EuropeanEcuadorianEgyptianEnglishEstonianEthiopianEuropeanFijianFilipinoFinnishFrenchFrench American IndianFrench CanadianGermanGerman RussianGhanaianGreekGuamanian/ChamorroGuatemalanGuyaneseHaitianHmongHonduranHopiHoumaHungarianIcelanderIndian (Asian)IndonesianInupiatIranianIraqiIrishIroquoisIsraeliItalianJamaicanJapaneseJordanianKenyanKiowaKoreanLaotianLatvianLebaneseLiberianLithuanianLumbeeLuxembourgerMacedonianMalaysianMalteseMarshalleseMenomineeMexicanMexican American IndianMongolianMoroccanNative HawaiianNavajoNepaleseNew ZealanderNicaraguanNigerianNorthern EuropeanNorwegianOkinawanOsageOttawaPaiutePakistaniPalestinianPanamanianParaguayanPennsylvania GermanPeruvianPimaPolishPortuguesePotawatomiPuebloPuerto RicanPuget Sound SalishRomanianRussianSalvadoranSamoanScandinavianScotch-IrishScottishSeminoleSenegaleseSerbianShoshoneSierra LeoneanSiouxSlavicSlovakSloveneSomaliSouth AfricanSouth AmericanSouth American IndianSoviet UnionSpaniardSpanish AmericanSpanish American IndianSri LankanSubsaharan AfricanSudaneseSwedishSwissSyrianTaiwaneseThaiTlingit-HaidaTohono O'OdhamTonganTrinidadian and TobagonianTsimshianTurkishU.S. Virgin IslanderUgandanUkrainianUruguayanUteVenezuelanVietnameseWelshWest IndianYakamaYaquiYugoslavianYumanYup'ikZimbabwean
Immigration
NonimmigrantsImmigrantsAfghanistanAfricaAlbaniaArgentinaArmeniaAsiaAustraliaAustriaBahamasBangladeshBarbadosBelarusBelgiumBelizeBoliviaBosnia and HerzegovinaBrazilBulgariaBurma/MyanmarCabo VerdeCambodiaCameroonCanadaCaribbeanCentral AmericaChileChinaColombiaCongoCosta RicaCroatiaCubaCzechoslovakiaDenmarkDominicaDominican RepublicEastern AfricaEastern AsiaEastern EuropeEcuadorEgyptEl SalvadorEnglandEritreaEthiopiaEuropeFijiFranceGermanyGhanaGreeceGrenadaGuatemalaGuyanaHaitiHondurasHong KongHungaryIndiaIndonesiaIranIraqIrelandIsraelItalyJamaicaJapanJordanKazakhstanKenyaKoreaKuwaitLaosLatin AmericaLatviaLebanonLiberiaLithuaniaMalaysiaMexicoMicronesiaMiddle AfricaMoldovaMoroccoNepalNetherlandsNicaraguaNigeriaNorth AmericaNorth MacedoniaNorthern AfricaNorthern EuropeNorwayOceaniaPakistanPanamaPeruPhilippinesPolandPortugalRomaniaRussiaSaudi ArabiaScotlandSenegalSerbiaSierra LeoneSingaporeSomaliaSouth AfricaSouth AmericaSouth Central AsiaSouth Eastern AsiaSouthern EuropeSpainSri LankaSt. Vincent and the GrenadinesSudanSwedenSwitzerlandSyriaTaiwanThailandTrinidad and TobagoTurkeyUgandaUkraineUruguayUzbekistanVenezuelaVietnamWest IndiesWestern AfricaWestern AsiaWestern EuropeYemenZaireZimbabweAzores
Unemployment
Income
Poverty
Unemployment
Labor Participation
Family Structure
Vehicle Availability
Education Level
Disability

Unemployment Comparison

Spanish

Paiute

Good
Tragic
5.2%
UNEMPLOYMENT
65.1/ 100
METRIC RATING
162nd/ 347
METRIC RANK
7.1%
UNEMPLOYMENT
0.0/ 100
METRIC RATING
326th/ 347
METRIC RANK

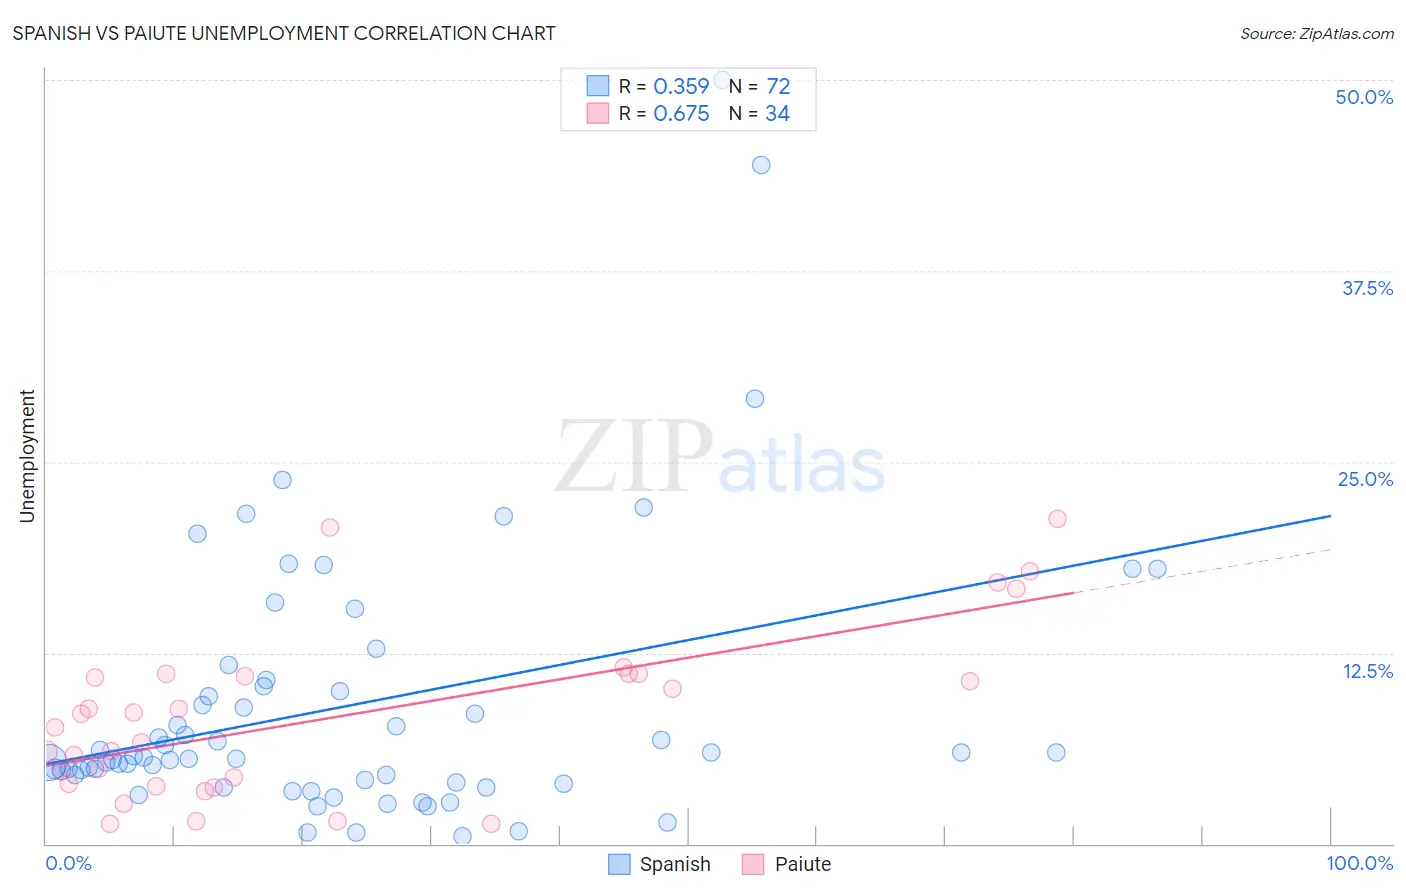
Spanish vs Paiute Unemployment Correlation Chart

The statistical analysis conducted on geographies consisting of 421,544,055 people shows a mild positive correlation between the proportion of Spanish and unemployment in the United States with a correlation coefficient (R) of 0.359 and weighted average of 5.2%. Similarly, the statistical analysis conducted on geographies consisting of 58,375,117 people shows a significant positive correlation between the proportion of Paiute and unemployment in the United States with a correlation coefficient (R) of 0.675 and weighted average of 7.1%, a difference of 36.6%.
Spanish vs Paiute Unemployment

Unemployment Correlation Summary

MeasurementSpanishPaiute
Minimum0.50%1.3%
Maximum50.0%21.3%
Range49.5%20.0%
Mean9.0%8.4%
Median5.6%8.1%
Interquartile 25% (IQ1)4.1%3.9%
Interquartile 75% (IQ3)10.2%11.1%
Interquartile Range (IQR)6.1%7.2%
Standard Deviation (Sample)9.0%5.5%
Standard Deviation (Population)8.9%5.4%

Similar Demographics by Unemployment

Demographics Similar to Spanish by Unemployment

In terms of unemployment, the demographic groups most similar to Spanish are Immigrants from Oceania (5.2%, a difference of 0.010%), Immigrants from Zaire (5.2%, a difference of 0.020%), Immigrants from Colombia (5.2%, a difference of 0.030%), Laotian (5.2%, a difference of 0.090%), and Immigrants from Egypt (5.2%, a difference of 0.11%).
DemographicsRating | RankUnemployment
Immigrants | Northern Africa
71.3
/100
|
#155
Good
5.2%
Immigrants | Kazakhstan
70.4
/100
|
#156
Good
5.2%
Sri Lankans
69.5
/100
|
#157
Good
5.2%
Immigrants | Egypt
66.7
/100
|
#158
Good
5.2%
Immigrants | Russia
66.6
/100
|
#159
Good
5.2%
Laotians
66.3
/100
|
#160
Good
5.2%
Immigrants | Oceania
65.2
/100
|
#161
Good
5.2%
Spanish
65.1
/100
|
#162
Good
5.2%
Immigrants | Zaire
64.7
/100
|
#163
Good
5.2%
Immigrants | Colombia
64.7
/100
|
#164
Good
5.2%
Immigrants | Brazil
63.1
/100
|
#165
Good
5.2%
Immigrants | Indonesia
61.2
/100
|
#166
Good
5.2%
Colombians
61.1
/100
|
#167
Good
5.2%
Uruguayans
60.2
/100
|
#168
Good
5.2%
Immigrants | Morocco
59.1
/100
|
#169
Average
5.2%

Demographics Similar to Paiute by Unemployment

In terms of unemployment, the demographic groups most similar to Paiute are Pueblo (7.2%, a difference of 0.53%), Native/Alaskan (7.0%, a difference of 1.1%), Tsimshian (7.2%, a difference of 1.4%), Immigrants from Armenia (7.0%, a difference of 1.7%), and Alaska Native (7.2%, a difference of 1.8%).
DemographicsRating | RankUnemployment
British West Indians
0.0
/100
|
#319
Tragic
6.8%
Immigrants | St. Vincent and the Grenadines
0.0
/100
|
#320
Tragic
6.9%
Immigrants | Guyana
0.0
/100
|
#321
Tragic
6.9%
Guyanese
0.0
/100
|
#322
Tragic
6.9%
Immigrants | Grenada
0.0
/100
|
#323
Tragic
6.9%
Immigrants | Armenia
0.0
/100
|
#324
Tragic
7.0%
Natives/Alaskans
0.0
/100
|
#325
Tragic
7.0%
Paiute
0.0
/100
|
#326
Tragic
7.1%
Pueblo
0.0
/100
|
#327
Tragic
7.2%
Tsimshian
0.0
/100
|
#328
Tragic
7.2%
Alaska Natives
0.0
/100
|
#329
Tragic
7.2%
Yakama
0.0
/100
|
#330
Tragic
7.3%
Dominicans
0.0
/100
|
#331
Tragic
7.4%
Sioux
0.0
/100
|
#332
Tragic
7.4%
Immigrants | Dominican Republic
0.0
/100
|
#333
Tragic
7.4%