Northern European vs Ghanaian Female Poverty Among 18-24 Year Olds
COMPARE
Northern European
Ghanaian
Female Poverty Among 18-24 Year Olds
Female Poverty Among 18-24 Year Olds Comparison
Northern Europeans
Ghanaians
20.6%
FEMALE POVERTY AMONG 18-24 YEAR OLDS
11.6/ 100
METRIC RATING
213th/ 347
METRIC RANK
20.8%
FEMALE POVERTY AMONG 18-24 YEAR OLDS
6.5/ 100
METRIC RATING
228th/ 347
METRIC RANK
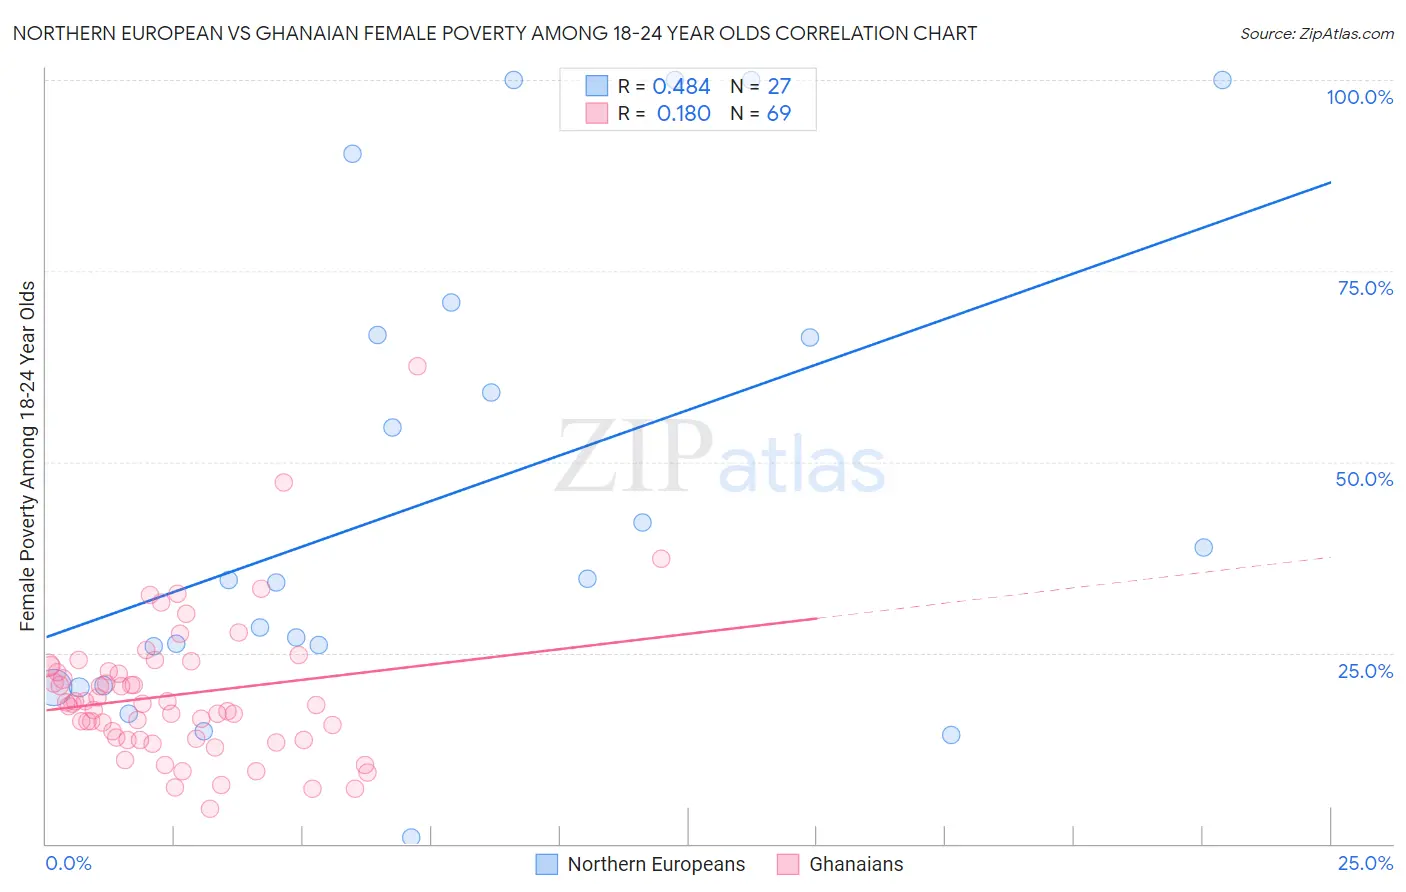
Northern European vs Ghanaian Female Poverty Among 18-24 Year Olds Correlation Chart
The statistical analysis conducted on geographies consisting of 393,501,500 people shows a moderate positive correlation between the proportion of Northern Europeans and poverty level among females between the ages 18 and 24 in the United States with a correlation coefficient (R) of 0.484 and weighted average of 20.6%. Similarly, the statistical analysis conducted on geographies consisting of 188,784,310 people shows a poor positive correlation between the proportion of Ghanaians and poverty level among females between the ages 18 and 24 in the United States with a correlation coefficient (R) of 0.180 and weighted average of 20.8%, a difference of 0.76%.
Female Poverty Among 18-24 Year Olds Correlation Summary
| Measurement | Northern European | Ghanaian |
| Minimum | 0.88% | 4.6% |
| Maximum | 100.0% | 62.5% |
| Range | 99.1% | 57.9% |
| Mean | 45.7% | 19.5% |
| Median | 34.6% | 18.3% |
| Interquartile 25% (IQ1) | 20.7% | 13.6% |
| Interquartile 75% (IQ3) | 66.7% | 22.9% |
| Interquartile Range (IQR) | 45.9% | 9.3% |
| Standard Deviation (Sample) | 30.7% | 9.3% |
| Standard Deviation (Population) | 30.1% | 9.2% |
Demographics Similar to Northern Europeans and Ghanaians by Female Poverty Among 18-24 Year Olds
In terms of female poverty among 18-24 year olds, the demographic groups most similar to Northern Europeans are Liberian (20.6%, a difference of 0.010%), Immigrants from South Africa (20.6%, a difference of 0.11%), Spanish (20.6%, a difference of 0.15%), Immigrants from Western Africa (20.6%, a difference of 0.17%), and Immigrants from Western Europe (20.6%, a difference of 0.21%). Similarly, the demographic groups most similar to Ghanaians are Immigrants from Sweden (20.7%, a difference of 0.060%), Australian (20.8%, a difference of 0.070%), White/Caucasian (20.8%, a difference of 0.070%), Estonian (20.7%, a difference of 0.13%), and Norwegian (20.7%, a difference of 0.15%).
| Demographics | Rating | Rank | Female Poverty Among 18-24 Year Olds |
| Immigrants | Ghana | 14.3 /100 | #210 | Poor 20.5% |
| Immigrants | Western Europe | 13.5 /100 | #211 | Poor 20.6% |
| Liberians | 11.6 /100 | #212 | Poor 20.6% |
| Northern Europeans | 11.6 /100 | #213 | Poor 20.6% |
| Immigrants | South Africa | 10.7 /100 | #214 | Poor 20.6% |
| Spanish | 10.4 /100 | #215 | Poor 20.6% |
| Immigrants | Western Africa | 10.2 /100 | #216 | Poor 20.6% |
| Immigrants | Laos | 9.7 /100 | #217 | Tragic 20.6% |
| Immigrants | Nepal | 9.6 /100 | #218 | Tragic 20.7% |
| Immigrants | Micronesia | 9.6 /100 | #219 | Tragic 20.7% |
| British | 9.4 /100 | #220 | Tragic 20.7% |
| Barbadians | 9.0 /100 | #221 | Tragic 20.7% |
| Guatemalans | 8.1 /100 | #222 | Tragic 20.7% |
| French | 7.9 /100 | #223 | Tragic 20.7% |
| Immigrants | Liberia | 7.6 /100 | #224 | Tragic 20.7% |
| Norwegians | 7.3 /100 | #225 | Tragic 20.7% |
| Estonians | 7.2 /100 | #226 | Tragic 20.7% |
| Immigrants | Sweden | 6.8 /100 | #227 | Tragic 20.7% |
| Ghanaians | 6.5 /100 | #228 | Tragic 20.8% |
| Australians | 6.1 /100 | #229 | Tragic 20.8% |
| Whites/Caucasians | 6.1 /100 | #230 | Tragic 20.8% |