Nonimmigrants vs Albanian Unemployment Among Ages 55 to 59 years
COMPARE
Nonimmigrants
Albanian
Unemployment Among Ages 55 to 59 years
Unemployment Among Ages 55 to 59 years Comparison
Nonimmigrants
Albanians
4.9%
UNEMPLOYMENT AMONG AGES 55 TO 59 YEARS
11.2/ 100
METRIC RATING
212th/ 347
METRIC RANK
5.0%
UNEMPLOYMENT AMONG AGES 55 TO 59 YEARS
2.5/ 100
METRIC RATING
232nd/ 347
METRIC RANK
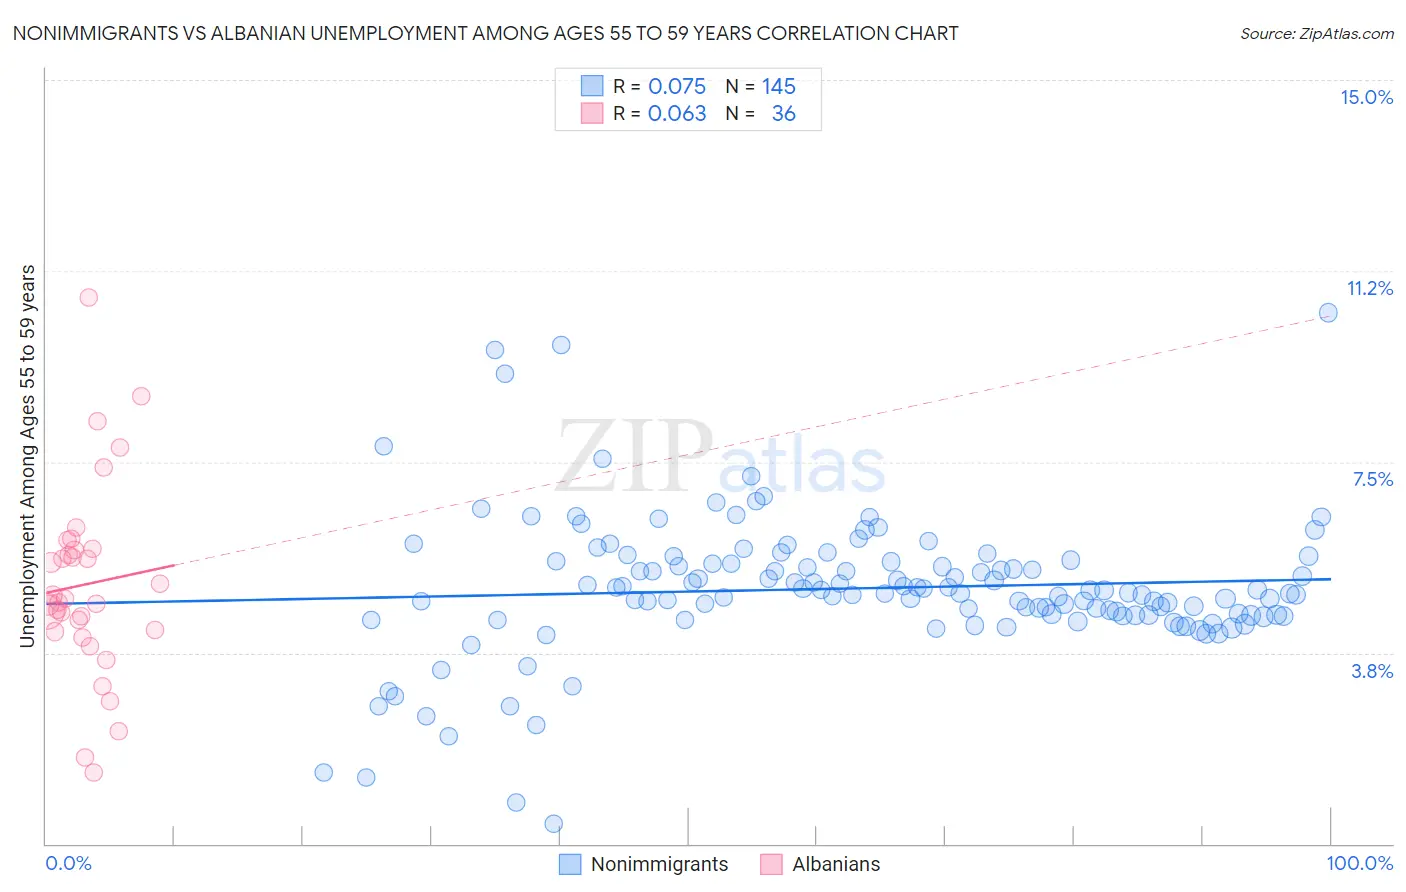
Nonimmigrants vs Albanian Unemployment Among Ages 55 to 59 years Correlation Chart
The statistical analysis conducted on geographies consisting of 492,378,712 people shows a slight positive correlation between the proportion of Nonimmigrants and unemployment rate among population between the ages 55 and 59 in the United States with a correlation coefficient (R) of 0.075 and weighted average of 4.9%. Similarly, the statistical analysis conducted on geographies consisting of 185,760,163 people shows a slight positive correlation between the proportion of Albanians and unemployment rate among population between the ages 55 and 59 in the United States with a correlation coefficient (R) of 0.063 and weighted average of 5.0%, a difference of 1.6%.
Unemployment Among Ages 55 to 59 years Correlation Summary
| Measurement | Nonimmigrants | Albanian |
| Minimum | 0.40% | 1.4% |
| Maximum | 10.4% | 10.7% |
| Range | 10.0% | 9.3% |
| Mean | 5.0% | 5.1% |
| Median | 4.9% | 4.8% |
| Interquartile 25% (IQ1) | 4.5% | 4.2% |
| Interquartile 75% (IQ3) | 5.5% | 5.8% |
| Interquartile Range (IQR) | 1.1% | 1.6% |
| Standard Deviation (Sample) | 1.4% | 1.9% |
| Standard Deviation (Population) | 1.4% | 1.9% |
Demographics Similar to Nonimmigrants and Albanians by Unemployment Among Ages 55 to 59 years
In terms of unemployment among ages 55 to 59 years, the demographic groups most similar to Nonimmigrants are Bermudan (4.9%, a difference of 0.020%), Immigrants from Denmark (4.9%, a difference of 0.090%), Syrian (4.9%, a difference of 0.29%), Spanish American (4.9%, a difference of 0.35%), and Immigrants from Brazil (4.9%, a difference of 0.36%). Similarly, the demographic groups most similar to Albanians are Cherokee (5.0%, a difference of 0.050%), Immigrants from Syria (5.0%, a difference of 0.080%), Immigrants from Western Asia (5.0%, a difference of 0.18%), Immigrants from Liberia (5.0%, a difference of 0.26%), and Immigrants from Iran (5.0%, a difference of 0.39%).
| Demographics | Rating | Rank | Unemployment Among Ages 55 to 59 years |
| Immigrants | Nonimmigrants | 11.2 /100 | #212 | Poor 4.9% |
| Bermudans | 11.0 /100 | #213 | Poor 4.9% |
| Immigrants | Denmark | 10.3 /100 | #214 | Poor 4.9% |
| Syrians | 8.6 /100 | #215 | Tragic 4.9% |
| Spanish Americans | 8.1 /100 | #216 | Tragic 4.9% |
| Immigrants | Brazil | 8.1 /100 | #217 | Tragic 4.9% |
| Immigrants | Austria | 8.0 /100 | #218 | Tragic 4.9% |
| Immigrants | Nigeria | 8.0 /100 | #219 | Tragic 4.9% |
| Indians (Asian) | 7.6 /100 | #220 | Tragic 4.9% |
| Nigerians | 7.5 /100 | #221 | Tragic 4.9% |
| Spanish | 5.1 /100 | #222 | Tragic 5.0% |
| Immigrants | Ireland | 4.8 /100 | #223 | Tragic 5.0% |
| Sub-Saharan Africans | 4.4 /100 | #224 | Tragic 5.0% |
| Costa Ricans | 4.4 /100 | #225 | Tragic 5.0% |
| Immigrants | China | 4.2 /100 | #226 | Tragic 5.0% |
| Immigrants | Iran | 3.7 /100 | #227 | Tragic 5.0% |
| Immigrants | Liberia | 3.2 /100 | #228 | Tragic 5.0% |
| Immigrants | Western Asia | 3.0 /100 | #229 | Tragic 5.0% |
| Immigrants | Syria | 2.7 /100 | #230 | Tragic 5.0% |
| Cherokee | 2.6 /100 | #231 | Tragic 5.0% |
| Albanians | 2.5 /100 | #232 | Tragic 5.0% |