Nonimmigrants vs Czech Unemployment Among Women with Children Ages 6 to 17 years
COMPARE
Nonimmigrants
Czech
Unemployment Among Women with Children Ages 6 to 17 years
Unemployment Among Women with Children Ages 6 to 17 years Comparison
Nonimmigrants
Czechs
10.0%
UNEMPLOYMENT AMONG WOMEN WITH CHILDREN AGES 6 TO 17 YEARS
0.0/ 100
METRIC RATING
291st/ 347
METRIC RANK
8.7%
UNEMPLOYMENT AMONG WOMEN WITH CHILDREN AGES 6 TO 17 YEARS
94.4/ 100
METRIC RATING
127th/ 347
METRIC RANK
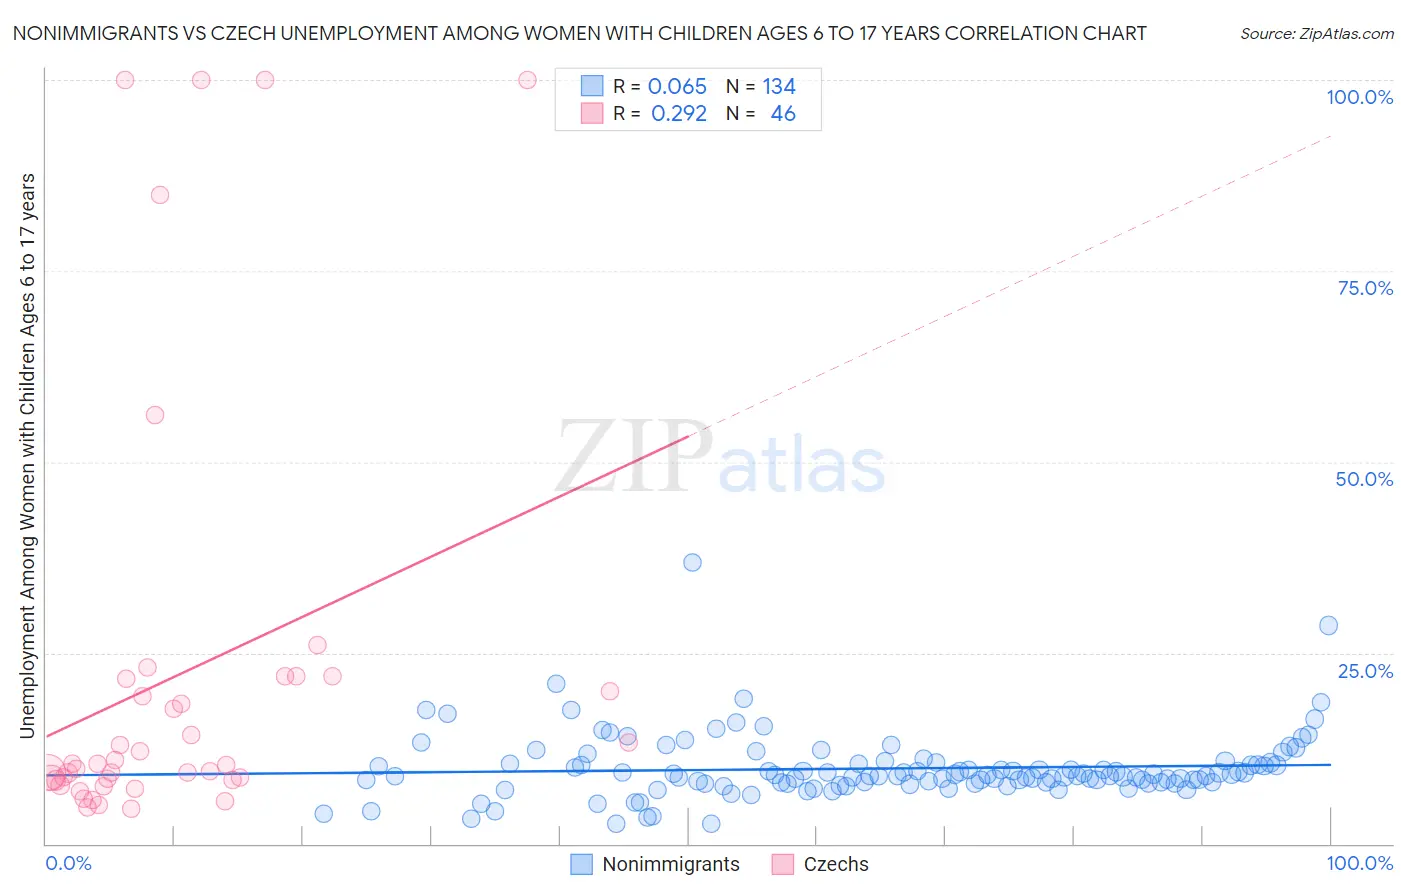
Nonimmigrants vs Czech Unemployment Among Women with Children Ages 6 to 17 years Correlation Chart
The statistical analysis conducted on geographies consisting of 361,515,464 people shows a slight positive correlation between the proportion of Nonimmigrants and unemployment rate among women with children between the ages 6 and 17 in the United States with a correlation coefficient (R) of 0.065 and weighted average of 10.0%. Similarly, the statistical analysis conducted on geographies consisting of 319,576,456 people shows a weak positive correlation between the proportion of Czechs and unemployment rate among women with children between the ages 6 and 17 in the United States with a correlation coefficient (R) of 0.292 and weighted average of 8.7%, a difference of 15.2%.
Unemployment Among Women with Children Ages 6 to 17 years Correlation Summary
| Measurement | Nonimmigrants | Czech |
| Minimum | 2.6% | 4.6% |
| Maximum | 36.8% | 100.0% |
| Range | 34.3% | 95.4% |
| Mean | 9.9% | 22.1% |
| Median | 8.9% | 10.4% |
| Interquartile 25% (IQ1) | 8.0% | 8.3% |
| Interquartile 75% (IQ3) | 10.5% | 21.6% |
| Interquartile Range (IQR) | 2.5% | 13.3% |
| Standard Deviation (Sample) | 4.3% | 27.9% |
| Standard Deviation (Population) | 4.3% | 27.6% |
Similar Demographics by Unemployment Among Women with Children Ages 6 to 17 years
Demographics Similar to Nonimmigrants by Unemployment Among Women with Children Ages 6 to 17 years
In terms of unemployment among women with children ages 6 to 17 years, the demographic groups most similar to Nonimmigrants are Carpatho Rusyn (10.0%, a difference of 0.010%), Subsaharan African (10.0%, a difference of 0.020%), Honduran (10.0%, a difference of 0.040%), Haitian (10.0%, a difference of 0.10%), and Ecuadorian (10.0%, a difference of 0.19%).
| Demographics | Rating | Rank | Unemployment Among Women with Children Ages 6 to 17 years |
| Yakama | 0.0 /100 | #284 | Tragic 9.9% |
| Hispanics or Latinos | 0.0 /100 | #285 | Tragic 9.9% |
| Choctaw | 0.0 /100 | #286 | Tragic 9.9% |
| Sierra Leoneans | 0.0 /100 | #287 | Tragic 9.9% |
| Shoshone | 0.0 /100 | #288 | Tragic 10.0% |
| Hondurans | 0.0 /100 | #289 | Tragic 10.0% |
| Sub-Saharan Africans | 0.0 /100 | #290 | Tragic 10.0% |
| Immigrants | Nonimmigrants | 0.0 /100 | #291 | Tragic 10.0% |
| Carpatho Rusyns | 0.0 /100 | #292 | Tragic 10.0% |
| Haitians | 0.0 /100 | #293 | Tragic 10.0% |
| Ecuadorians | 0.0 /100 | #294 | Tragic 10.0% |
| Cherokee | 0.0 /100 | #295 | Tragic 10.0% |
| Immigrants | Western Africa | 0.0 /100 | #296 | Tragic 10.1% |
| Immigrants | Caribbean | 0.0 /100 | #297 | Tragic 10.1% |
| Immigrants | Haiti | 0.0 /100 | #298 | Tragic 10.1% |
Demographics Similar to Czechs by Unemployment Among Women with Children Ages 6 to 17 years
In terms of unemployment among women with children ages 6 to 17 years, the demographic groups most similar to Czechs are Immigrants from Northern Africa (8.7%, a difference of 0.010%), Hmong (8.7%, a difference of 0.020%), South African (8.7%, a difference of 0.030%), Immigrants from Morocco (8.7%, a difference of 0.10%), and Immigrants from Lebanon (8.7%, a difference of 0.10%).
| Demographics | Rating | Rank | Unemployment Among Women with Children Ages 6 to 17 years |
| Israelis | 95.9 /100 | #120 | Exceptional 8.7% |
| Immigrants | Denmark | 95.5 /100 | #121 | Exceptional 8.7% |
| Immigrants | Egypt | 95.0 /100 | #122 | Exceptional 8.7% |
| Immigrants | Morocco | 94.9 /100 | #123 | Exceptional 8.7% |
| Immigrants | Lebanon | 94.9 /100 | #124 | Exceptional 8.7% |
| South Africans | 94.6 /100 | #125 | Exceptional 8.7% |
| Immigrants | Northern Africa | 94.4 /100 | #126 | Exceptional 8.7% |
| Czechs | 94.4 /100 | #127 | Exceptional 8.7% |
| Hmong | 94.3 /100 | #128 | Exceptional 8.7% |
| Barbadians | 93.8 /100 | #129 | Exceptional 8.7% |
| Immigrants | Western Asia | 93.1 /100 | #130 | Exceptional 8.7% |
| Slavs | 92.2 /100 | #131 | Exceptional 8.7% |
| Yaqui | 92.2 /100 | #132 | Exceptional 8.7% |
| Egyptians | 91.8 /100 | #133 | Exceptional 8.7% |
| Immigrants | Ireland | 91.0 /100 | #134 | Exceptional 8.7% |