Immigrants from Egypt vs Chinese Unemployment Among Ages 65 to 74 years
COMPARE
Immigrants from Egypt
Chinese
Unemployment Among Ages 65 to 74 years
Unemployment Among Ages 65 to 74 years Comparison
Immigrants from Egypt
Chinese
5.4%
UNEMPLOYMENT AMONG AGES 65 TO 74 YEARS
26.5/ 100
METRIC RATING
191st/ 347
METRIC RANK
4.4%
UNEMPLOYMENT AMONG AGES 65 TO 74 YEARS
100.0/ 100
METRIC RATING
2nd/ 347
METRIC RANK
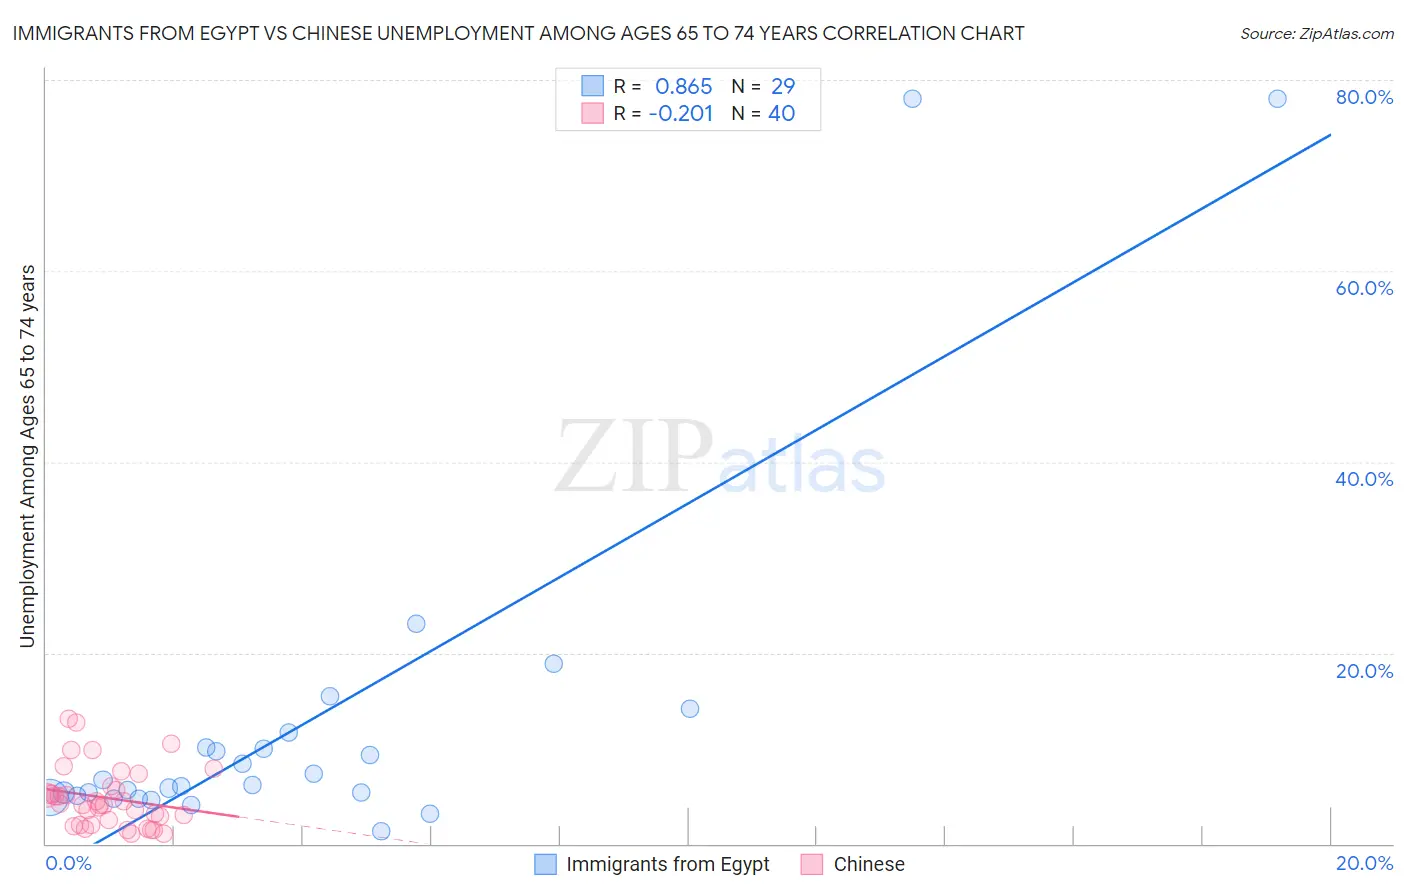
Immigrants from Egypt vs Chinese Unemployment Among Ages 65 to 74 years Correlation Chart
The statistical analysis conducted on geographies consisting of 229,387,949 people shows a very strong positive correlation between the proportion of Immigrants from Egypt and unemployment rate among population between the ages 65 and 74 in the United States with a correlation coefficient (R) of 0.865 and weighted average of 5.4%. Similarly, the statistical analysis conducted on geographies consisting of 62,031,641 people shows a weak negative correlation between the proportion of Chinese and unemployment rate among population between the ages 65 and 74 in the United States with a correlation coefficient (R) of -0.201 and weighted average of 4.4%, a difference of 21.7%.
Unemployment Among Ages 65 to 74 years Correlation Summary
| Measurement | Immigrants from Egypt | Chinese |
| Minimum | 1.3% | 1.0% |
| Maximum | 78.0% | 13.1% |
| Range | 76.7% | 12.1% |
| Mean | 12.9% | 4.8% |
| Median | 6.1% | 4.2% |
| Interquartile 25% (IQ1) | 4.9% | 2.2% |
| Interquartile 75% (IQ3) | 10.9% | 5.8% |
| Interquartile Range (IQR) | 5.9% | 3.6% |
| Standard Deviation (Sample) | 18.7% | 3.1% |
| Standard Deviation (Population) | 18.3% | 3.1% |
Similar Demographics by Unemployment Among Ages 65 to 74 years
Demographics Similar to Immigrants from Egypt by Unemployment Among Ages 65 to 74 years
In terms of unemployment among ages 65 to 74 years, the demographic groups most similar to Immigrants from Egypt are Basque (5.4%, a difference of 0.0%), Maltese (5.4%, a difference of 0.010%), Cherokee (5.4%, a difference of 0.030%), Immigrants from Africa (5.4%, a difference of 0.070%), and Immigrants from Denmark (5.4%, a difference of 0.080%).
| Demographics | Rating | Rank | Unemployment Among Ages 65 to 74 years |
| Immigrants | Senegal | 35.2 /100 | #184 | Fair 5.4% |
| Russians | 34.4 /100 | #185 | Fair 5.4% |
| Lithuanians | 32.4 /100 | #186 | Fair 5.4% |
| Immigrants | Nonimmigrants | 30.6 /100 | #187 | Fair 5.4% |
| Immigrants | Europe | 28.8 /100 | #188 | Fair 5.4% |
| Immigrants | Africa | 28.3 /100 | #189 | Fair 5.4% |
| Basques | 26.6 /100 | #190 | Fair 5.4% |
| Immigrants | Egypt | 26.5 /100 | #191 | Fair 5.4% |
| Maltese | 26.4 /100 | #192 | Fair 5.4% |
| Cherokee | 25.8 /100 | #193 | Fair 5.4% |
| Immigrants | Denmark | 24.7 /100 | #194 | Fair 5.4% |
| Immigrants | China | 24.2 /100 | #195 | Fair 5.4% |
| Costa Ricans | 21.1 /100 | #196 | Fair 5.4% |
| Colville | 20.4 /100 | #197 | Fair 5.4% |
| Albanians | 17.8 /100 | #198 | Poor 5.4% |
Demographics Similar to Chinese by Unemployment Among Ages 65 to 74 years
In terms of unemployment among ages 65 to 74 years, the demographic groups most similar to Chinese are Fijian (4.5%, a difference of 1.6%), Tsimshian (4.6%, a difference of 3.1%), Sudanese (4.6%, a difference of 3.5%), Immigrants from Cuba (4.6%, a difference of 4.0%), and Indonesian (4.7%, a difference of 5.5%).
| Demographics | Rating | Rank | Unemployment Among Ages 65 to 74 years |
| Hmong | 100.0 /100 | #1 | Exceptional 4.2% |
| Chinese | 100.0 /100 | #2 | Exceptional 4.4% |
| Fijians | 100.0 /100 | #3 | Exceptional 4.5% |
| Tsimshian | 100.0 /100 | #4 | Exceptional 4.6% |
| Sudanese | 100.0 /100 | #5 | Exceptional 4.6% |
| Immigrants | Cuba | 100.0 /100 | #6 | Exceptional 4.6% |
| Indonesians | 100.0 /100 | #7 | Exceptional 4.7% |
| Comanche | 100.0 /100 | #8 | Exceptional 4.7% |
| Chickasaw | 100.0 /100 | #9 | Exceptional 4.7% |
| Osage | 100.0 /100 | #10 | Exceptional 4.7% |
| Immigrants | Congo | 100.0 /100 | #11 | Exceptional 4.7% |
| Tongans | 100.0 /100 | #12 | Exceptional 4.7% |
| Lumbee | 100.0 /100 | #13 | Exceptional 4.8% |
| Cubans | 100.0 /100 | #14 | Exceptional 4.8% |
| Immigrants | North Macedonia | 100.0 /100 | #15 | Exceptional 4.8% |