Pima vs Black/African American Unemployment Among Seniors over 75 years
COMPARE
Pima
Black/African American
Unemployment Among Seniors over 75 years
Unemployment Among Seniors over 75 years Comparison
Pima
Blacks/African Americans
9.2%
UNEMPLOYMENT AMONG SENIORS OVER 75 YEARS
1.8/ 100
METRIC RATING
253rd/ 347
METRIC RANK
9.4%
UNEMPLOYMENT AMONG SENIORS OVER 75 YEARS
0.5/ 100
METRIC RATING
266th/ 347
METRIC RANK
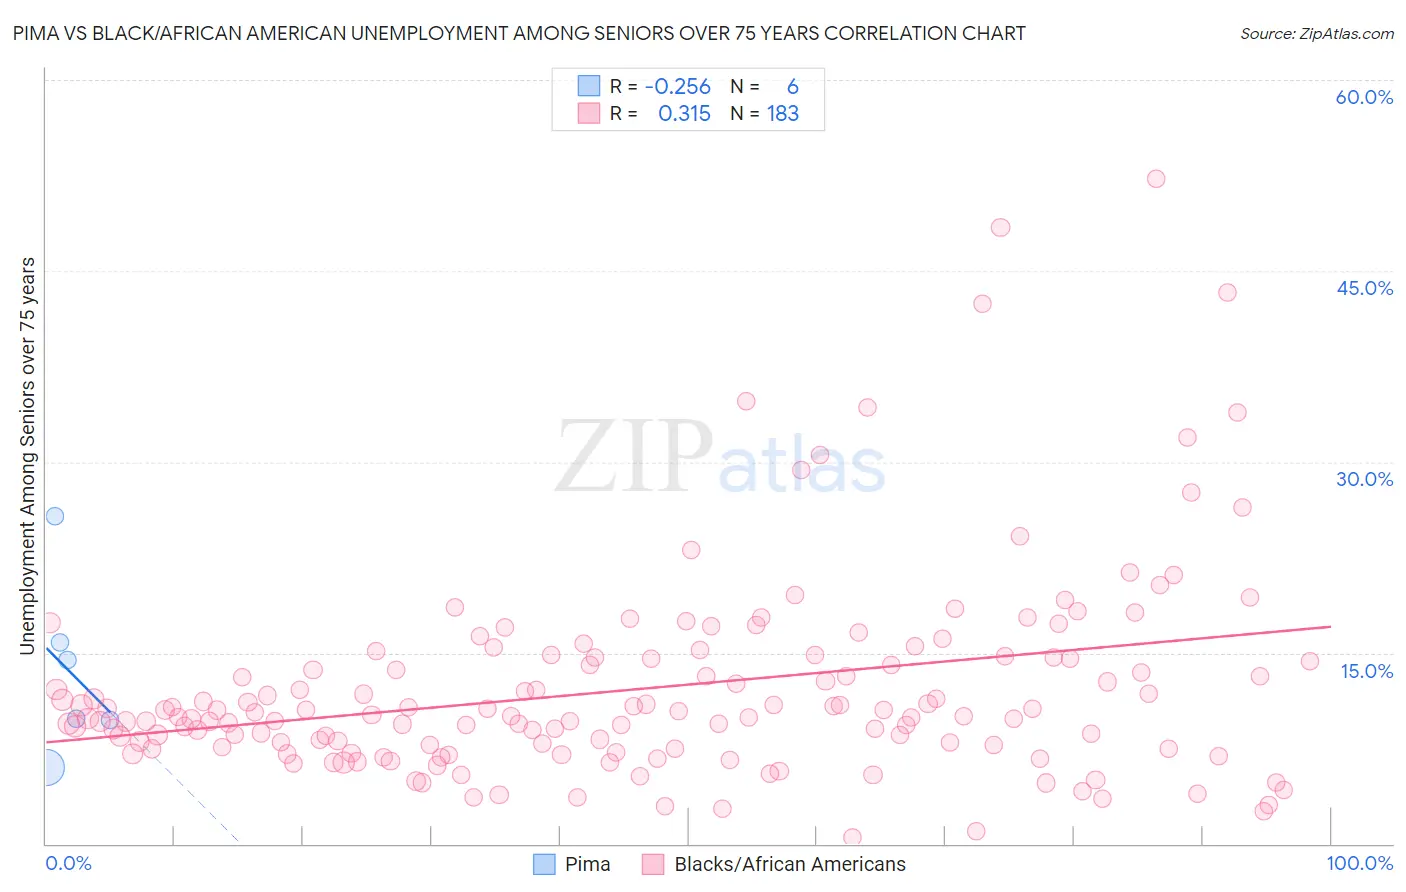
Pima vs Black/African American Unemployment Among Seniors over 75 years Correlation Chart
The statistical analysis conducted on geographies consisting of 52,282,619 people shows a weak negative correlation between the proportion of Pima and unemployment rate among seniors over the age of 75 in the United States with a correlation coefficient (R) of -0.256 and weighted average of 9.2%. Similarly, the statistical analysis conducted on geographies consisting of 234,580,439 people shows a mild positive correlation between the proportion of Blacks/African Americans and unemployment rate among seniors over the age of 75 in the United States with a correlation coefficient (R) of 0.315 and weighted average of 9.4%, a difference of 1.7%.
Unemployment Among Seniors over 75 years Correlation Summary
| Measurement | Pima | Black/African American |
| Minimum | 5.9% | 0.50% |
| Maximum | 25.7% | 52.2% |
| Range | 19.8% | 51.7% |
| Mean | 13.6% | 12.2% |
| Median | 12.1% | 10.2% |
| Interquartile 25% (IQ1) | 9.7% | 7.6% |
| Interquartile 75% (IQ3) | 15.8% | 14.6% |
| Interquartile Range (IQR) | 6.1% | 7.0% |
| Standard Deviation (Sample) | 6.9% | 8.0% |
| Standard Deviation (Population) | 6.3% | 8.0% |
Demographics Similar to Pima and Blacks/African Americans by Unemployment Among Seniors over 75 years
In terms of unemployment among seniors over 75 years, the demographic groups most similar to Pima are Immigrants from Ghana (9.2%, a difference of 0.090%), Immigrants from Sudan (9.2%, a difference of 0.14%), Immigrants from Poland (9.2%, a difference of 0.16%), Central American Indian (9.2%, a difference of 0.26%), and Immigrants from Saudi Arabia (9.2%, a difference of 0.27%). Similarly, the demographic groups most similar to Blacks/African Americans are Immigrants from Mexico (9.4%, a difference of 0.12%), Greek (9.4%, a difference of 0.28%), Palestinian (9.3%, a difference of 0.32%), Puerto Rican (9.4%, a difference of 0.42%), and Iroquois (9.3%, a difference of 0.45%).
| Demographics | Rating | Rank | Unemployment Among Seniors over 75 years |
| Immigrants | Saudi Arabia | 2.2 /100 | #249 | Tragic 9.2% |
| Central American Indians | 2.2 /100 | #250 | Tragic 9.2% |
| Immigrants | Poland | 2.0 /100 | #251 | Tragic 9.2% |
| Immigrants | Sudan | 2.0 /100 | #252 | Tragic 9.2% |
| Pima | 1.8 /100 | #253 | Tragic 9.2% |
| Immigrants | Ghana | 1.7 /100 | #254 | Tragic 9.2% |
| Immigrants | Scotland | 1.4 /100 | #255 | Tragic 9.2% |
| Brazilians | 1.3 /100 | #256 | Tragic 9.3% |
| Hawaiians | 1.2 /100 | #257 | Tragic 9.3% |
| Immigrants | England | 1.0 /100 | #258 | Tragic 9.3% |
| Slovenes | 1.0 /100 | #259 | Tragic 9.3% |
| Immigrants | Cameroon | 1.0 /100 | #260 | Tragic 9.3% |
| Celtics | 0.8 /100 | #261 | Tragic 9.3% |
| Austrians | 0.7 /100 | #262 | Tragic 9.3% |
| Ukrainians | 0.7 /100 | #263 | Tragic 9.3% |
| Iroquois | 0.7 /100 | #264 | Tragic 9.3% |
| Palestinians | 0.6 /100 | #265 | Tragic 9.3% |
| Blacks/African Americans | 0.5 /100 | #266 | Tragic 9.4% |
| Immigrants | Mexico | 0.4 /100 | #267 | Tragic 9.4% |
| Greeks | 0.4 /100 | #268 | Tragic 9.4% |
| Puerto Ricans | 0.3 /100 | #269 | Tragic 9.4% |