New Zealander vs Immigrants from Western Africa Unemployment Among Ages 65 to 74 years
COMPARE
New Zealander
Immigrants from Western Africa
Unemployment Among Ages 65 to 74 years
Unemployment Among Ages 65 to 74 years Comparison
New Zealanders
Immigrants from Western Africa
5.3%
UNEMPLOYMENT AMONG AGES 65 TO 74 YEARS
76.1/ 100
METRIC RATING
143rd/ 347
METRIC RANK
5.6%
UNEMPLOYMENT AMONG AGES 65 TO 74 YEARS
0.3/ 100
METRIC RATING
258th/ 347
METRIC RANK
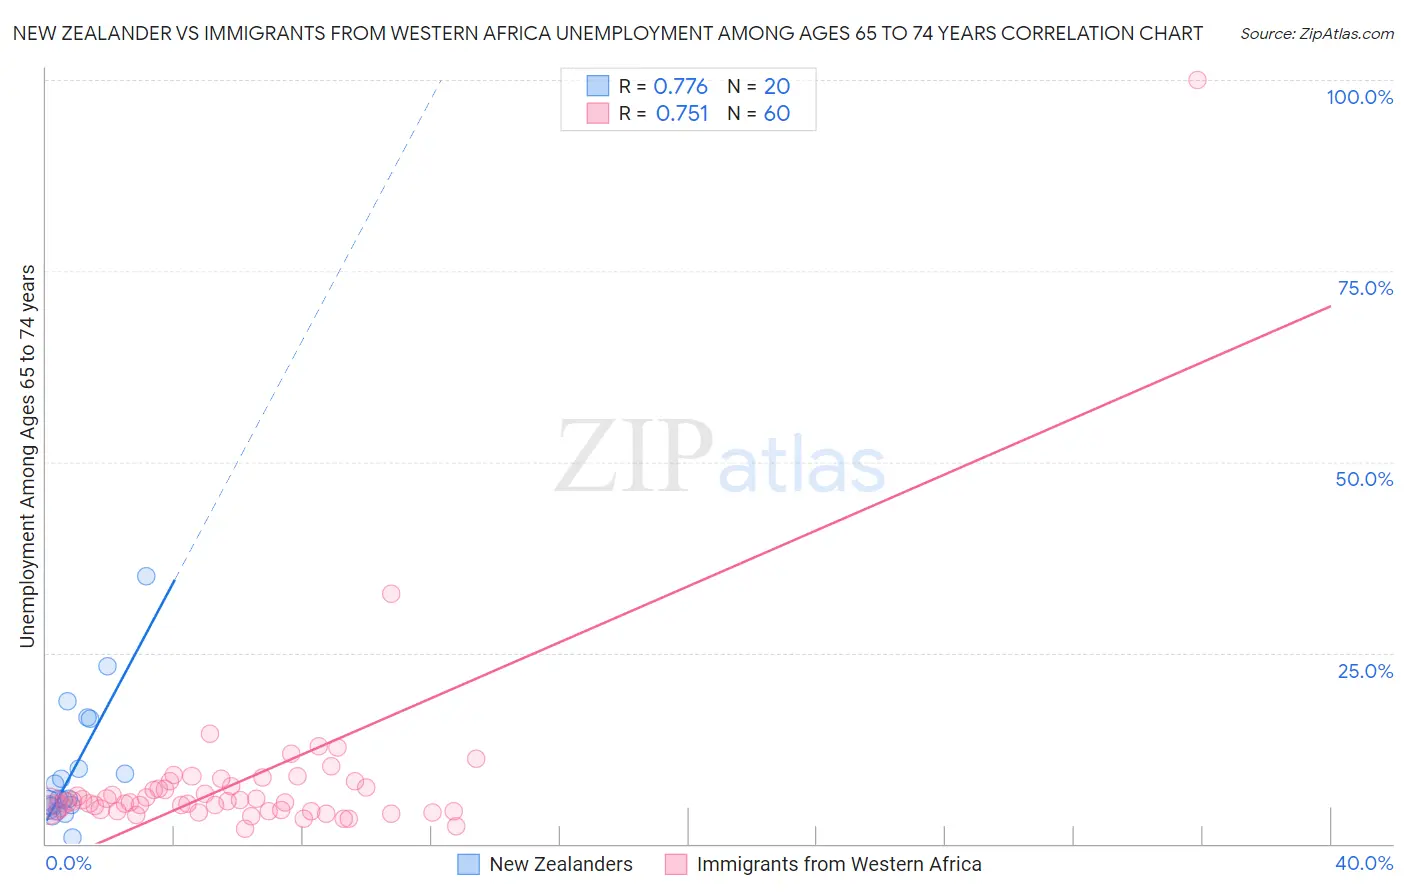
New Zealander vs Immigrants from Western Africa Unemployment Among Ages 65 to 74 years Correlation Chart
The statistical analysis conducted on geographies consisting of 102,646,016 people shows a strong positive correlation between the proportion of New Zealanders and unemployment rate among population between the ages 65 and 74 in the United States with a correlation coefficient (R) of 0.776 and weighted average of 5.3%. Similarly, the statistical analysis conducted on geographies consisting of 321,582,029 people shows a strong positive correlation between the proportion of Immigrants from Western Africa and unemployment rate among population between the ages 65 and 74 in the United States with a correlation coefficient (R) of 0.751 and weighted average of 5.6%, a difference of 6.0%.
Unemployment Among Ages 65 to 74 years Correlation Summary
| Measurement | New Zealander | Immigrants from Western Africa |
| Minimum | 0.82% | 2.0% |
| Maximum | 35.1% | 100.0% |
| Range | 34.3% | 98.0% |
| Mean | 9.8% | 8.2% |
| Median | 6.0% | 5.5% |
| Interquartile 25% (IQ1) | 4.9% | 4.4% |
| Interquartile 75% (IQ3) | 13.1% | 7.9% |
| Interquartile Range (IQR) | 8.1% | 3.5% |
| Standard Deviation (Sample) | 8.3% | 12.8% |
| Standard Deviation (Population) | 8.1% | 12.7% |
Similar Demographics by Unemployment Among Ages 65 to 74 years
Demographics Similar to New Zealanders by Unemployment Among Ages 65 to 74 years
In terms of unemployment among ages 65 to 74 years, the demographic groups most similar to New Zealanders are Turkish (5.3%, a difference of 0.0%), Immigrants from Chile (5.3%, a difference of 0.0%), Canadian (5.3%, a difference of 0.050%), Irish (5.3%, a difference of 0.060%), and Immigrants from Latvia (5.3%, a difference of 0.070%).
| Demographics | Rating | Rank | Unemployment Among Ages 65 to 74 years |
| Celtics | 80.8 /100 | #136 | Excellent 5.3% |
| Immigrants | Afghanistan | 80.8 /100 | #137 | Excellent 5.3% |
| Chileans | 79.7 /100 | #138 | Good 5.3% |
| Finns | 79.0 /100 | #139 | Good 5.3% |
| Immigrants | Laos | 78.6 /100 | #140 | Good 5.3% |
| Immigrants | Asia | 78.4 /100 | #141 | Good 5.3% |
| Turks | 76.2 /100 | #142 | Good 5.3% |
| New Zealanders | 76.1 /100 | #143 | Good 5.3% |
| Immigrants | Chile | 76.0 /100 | #144 | Good 5.3% |
| Canadians | 75.0 /100 | #145 | Good 5.3% |
| Irish | 74.8 /100 | #146 | Good 5.3% |
| Immigrants | Latvia | 74.6 /100 | #147 | Good 5.3% |
| Immigrants | Sri Lanka | 73.8 /100 | #148 | Good 5.3% |
| Immigrants | Romania | 73.5 /100 | #149 | Good 5.3% |
| Immigrants | Poland | 73.2 /100 | #150 | Good 5.3% |
Demographics Similar to Immigrants from Western Africa by Unemployment Among Ages 65 to 74 years
In terms of unemployment among ages 65 to 74 years, the demographic groups most similar to Immigrants from Western Africa are Sierra Leonean (5.6%, a difference of 0.070%), Immigrants from Barbados (5.6%, a difference of 0.10%), South American (5.6%, a difference of 0.14%), Immigrants from Southern Europe (5.6%, a difference of 0.16%), and Immigrants from St. Vincent and the Grenadines (5.6%, a difference of 0.19%).
| Demographics | Rating | Rank | Unemployment Among Ages 65 to 74 years |
| Brazilians | 0.5 /100 | #251 | Tragic 5.6% |
| Colombians | 0.5 /100 | #252 | Tragic 5.6% |
| Immigrants | Brazil | 0.5 /100 | #253 | Tragic 5.6% |
| Immigrants | Costa Rica | 0.5 /100 | #254 | Tragic 5.6% |
| Immigrants | Haiti | 0.4 /100 | #255 | Tragic 5.6% |
| Native Hawaiians | 0.4 /100 | #256 | Tragic 5.6% |
| Immigrants | Southern Europe | 0.3 /100 | #257 | Tragic 5.6% |
| Immigrants | Western Africa | 0.3 /100 | #258 | Tragic 5.6% |
| Sierra Leoneans | 0.2 /100 | #259 | Tragic 5.6% |
| Immigrants | Barbados | 0.2 /100 | #260 | Tragic 5.6% |
| South Americans | 0.2 /100 | #261 | Tragic 5.6% |
| Immigrants | St. Vincent and the Grenadines | 0.2 /100 | #262 | Tragic 5.6% |
| Immigrants | Jamaica | 0.2 /100 | #263 | Tragic 5.6% |
| Pueblo | 0.2 /100 | #264 | Tragic 5.6% |
| Jamaicans | 0.2 /100 | #265 | Tragic 5.6% |