Immigrants from El Salvador vs Immigrants from Western Africa Unemployment Among Ages 65 to 74 years
COMPARE
Immigrants from El Salvador
Immigrants from Western Africa
Unemployment Among Ages 65 to 74 years
Unemployment Among Ages 65 to 74 years Comparison
Immigrants from El Salvador
Immigrants from Western Africa
5.9%
UNEMPLOYMENT AMONG AGES 65 TO 74 YEARS
0.0/ 100
METRIC RATING
316th/ 347
METRIC RANK
5.6%
UNEMPLOYMENT AMONG AGES 65 TO 74 YEARS
0.3/ 100
METRIC RATING
258th/ 347
METRIC RANK
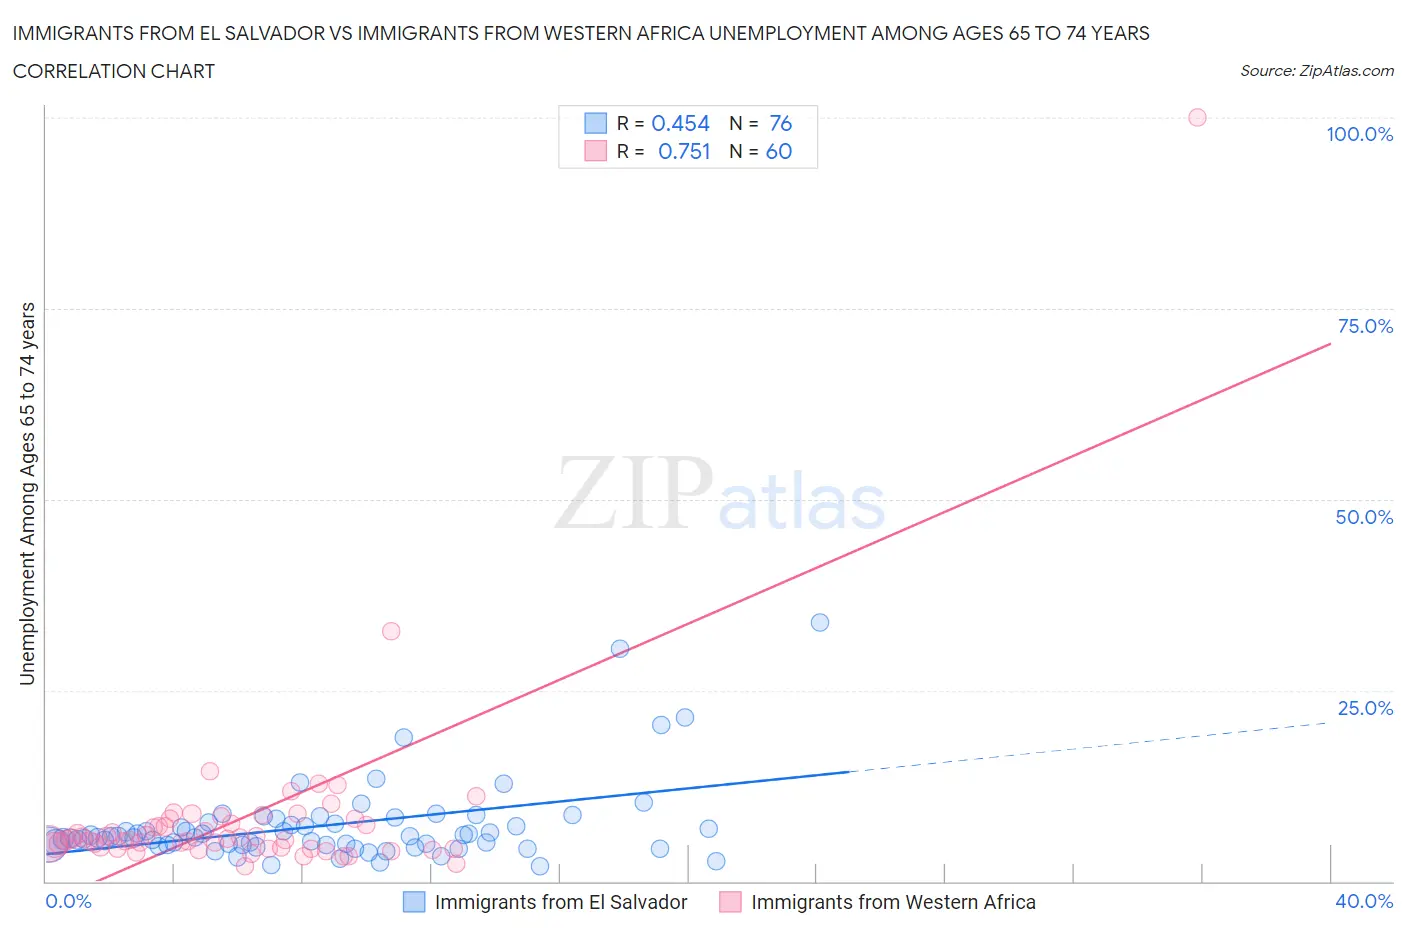
Immigrants from El Salvador vs Immigrants from Western Africa Unemployment Among Ages 65 to 74 years Correlation Chart
The statistical analysis conducted on geographies consisting of 318,434,053 people shows a moderate positive correlation between the proportion of Immigrants from El Salvador and unemployment rate among population between the ages 65 and 74 in the United States with a correlation coefficient (R) of 0.454 and weighted average of 5.9%. Similarly, the statistical analysis conducted on geographies consisting of 321,582,029 people shows a strong positive correlation between the proportion of Immigrants from Western Africa and unemployment rate among population between the ages 65 and 74 in the United States with a correlation coefficient (R) of 0.751 and weighted average of 5.6%, a difference of 4.6%.
Unemployment Among Ages 65 to 74 years Correlation Summary
| Measurement | Immigrants from El Salvador | Immigrants from Western Africa |
| Minimum | 1.9% | 2.0% |
| Maximum | 33.9% | 100.0% |
| Range | 32.0% | 98.0% |
| Mean | 7.3% | 8.2% |
| Median | 5.8% | 5.5% |
| Interquartile 25% (IQ1) | 4.8% | 4.4% |
| Interquartile 75% (IQ3) | 7.7% | 7.9% |
| Interquartile Range (IQR) | 2.9% | 3.5% |
| Standard Deviation (Sample) | 5.5% | 12.8% |
| Standard Deviation (Population) | 5.4% | 12.7% |
Similar Demographics by Unemployment Among Ages 65 to 74 years
Demographics Similar to Immigrants from El Salvador by Unemployment Among Ages 65 to 74 years
In terms of unemployment among ages 65 to 74 years, the demographic groups most similar to Immigrants from El Salvador are Immigrants from Guatemala (5.9%, a difference of 0.32%), Immigrants from Venezuela (5.9%, a difference of 0.33%), Immigrants from Central America (5.9%, a difference of 0.49%), Vietnamese (5.9%, a difference of 0.51%), and Hispanic or Latino (5.9%, a difference of 0.70%).
| Demographics | Rating | Rank | Unemployment Among Ages 65 to 74 years |
| Immigrants | Ecuador | 0.0 /100 | #309 | Tragic 5.8% |
| Immigrants | Bangladesh | 0.0 /100 | #310 | Tragic 5.9% |
| Venezuelans | 0.0 /100 | #311 | Tragic 5.9% |
| Hispanics or Latinos | 0.0 /100 | #312 | Tragic 5.9% |
| Vietnamese | 0.0 /100 | #313 | Tragic 5.9% |
| Immigrants | Venezuela | 0.0 /100 | #314 | Tragic 5.9% |
| Immigrants | Guatemala | 0.0 /100 | #315 | Tragic 5.9% |
| Immigrants | El Salvador | 0.0 /100 | #316 | Tragic 5.9% |
| Immigrants | Central America | 0.0 /100 | #317 | Tragic 5.9% |
| Zimbabweans | 0.0 /100 | #318 | Tragic 5.9% |
| Aleuts | 0.0 /100 | #319 | Tragic 5.9% |
| Immigrants | Bahamas | 0.0 /100 | #320 | Tragic 5.9% |
| Immigrants | Dominica | 0.0 /100 | #321 | Tragic 6.0% |
| Immigrants | Mexico | 0.0 /100 | #322 | Tragic 6.0% |
| Delaware | 0.0 /100 | #323 | Tragic 6.0% |
Demographics Similar to Immigrants from Western Africa by Unemployment Among Ages 65 to 74 years
In terms of unemployment among ages 65 to 74 years, the demographic groups most similar to Immigrants from Western Africa are Sierra Leonean (5.6%, a difference of 0.070%), Immigrants from Barbados (5.6%, a difference of 0.10%), South American (5.6%, a difference of 0.14%), Immigrants from Southern Europe (5.6%, a difference of 0.16%), and Immigrants from St. Vincent and the Grenadines (5.6%, a difference of 0.19%).
| Demographics | Rating | Rank | Unemployment Among Ages 65 to 74 years |
| Brazilians | 0.5 /100 | #251 | Tragic 5.6% |
| Colombians | 0.5 /100 | #252 | Tragic 5.6% |
| Immigrants | Brazil | 0.5 /100 | #253 | Tragic 5.6% |
| Immigrants | Costa Rica | 0.5 /100 | #254 | Tragic 5.6% |
| Immigrants | Haiti | 0.4 /100 | #255 | Tragic 5.6% |
| Native Hawaiians | 0.4 /100 | #256 | Tragic 5.6% |
| Immigrants | Southern Europe | 0.3 /100 | #257 | Tragic 5.6% |
| Immigrants | Western Africa | 0.3 /100 | #258 | Tragic 5.6% |
| Sierra Leoneans | 0.2 /100 | #259 | Tragic 5.6% |
| Immigrants | Barbados | 0.2 /100 | #260 | Tragic 5.6% |
| South Americans | 0.2 /100 | #261 | Tragic 5.6% |
| Immigrants | St. Vincent and the Grenadines | 0.2 /100 | #262 | Tragic 5.6% |
| Immigrants | Jamaica | 0.2 /100 | #263 | Tragic 5.6% |
| Pueblo | 0.2 /100 | #264 | Tragic 5.6% |
| Jamaicans | 0.2 /100 | #265 | Tragic 5.6% |