New Zealander vs Immigrants from Western Africa Unemployment Among Seniors over 75 years

COMPARE

New Zealander
Race
Ancestry
AfghanAfricanAlaska NativeAlaskan AthabascanAlbanianAleutAlsatianAmericanApacheArabArapahoArgentineanArmenianAssyrian/Chaldean/SyriacAustralianAustrianBahamianBangladeshiBarbadianBasqueBelgianBelizeanBermudanBhutaneseBlackfeetBolivianBrazilianBritishBritish West IndianBulgarianBurmeseCajunCambodianCanadianCape VerdeanCarpatho RusynCelticCentral AmericanCentral American IndianCherokeeCheyenneChickasawChileanChineseChippewaChoctawColombianColvilleComancheCosta RicanCreeCreekCroatianCrowCubanCypriotCzechCzechoslovakianDanishDelawareDominicanDutchDutch West IndianEastern EuropeanEcuadorianEgyptianEnglishEstonianEthiopianEuropeanFijianFilipinoFinnishFrenchFrench American IndianFrench CanadianGermanGerman RussianGhanaianGreekGuamanian/ChamorroGuatemalanGuyaneseHaitianHmongHonduranHopiHoumaHungarianIcelanderIndian (Asian)IndonesianInupiatIranianIraqiIrishIroquoisIsraeliItalianJamaicanJapaneseJordanianKenyanKiowaKoreanLaotianLatvianLebaneseLiberianLithuanianLumbeeLuxembourgerMacedonianMalaysianMalteseMarshalleseMexicanMexican American IndianMongolianMoroccanNative HawaiianNavajoNepaleseNew ZealanderNicaraguanNigerianNorthern EuropeanNorwegianOkinawanOsageOttawaPaiutePakistaniPalestinianPanamanianParaguayanPennsylvania GermanPeruvianPimaPolishPortuguesePotawatomiPuebloPuerto RicanPuget Sound SalishRomanianRussianSalvadoranSamoanScandinavianScotch-IrishScottishSeminoleSenegaleseSerbianShoshoneSierra LeoneanSiouxSlavicSlovakSloveneSomaliSouth AfricanSouth AmericanSouth American IndianSoviet UnionSpaniardSpanishSpanish AmericanSpanish American IndianSri LankanSubsaharan AfricanSudaneseSwedishSwissSyrianTaiwaneseThaiTlingit-HaidaTohono O'OdhamTonganTrinidadian and TobagonianTsimshianTurkishU.S. Virgin IslanderUgandanUkrainianUruguayanUteVenezuelanVietnameseWelshWest IndianYakamaYaquiYugoslavianYumanYup'ikZimbabwean
Immigration
NonimmigrantsImmigrantsAfghanistanAfricaAlbaniaArgentinaArmeniaAsiaAustraliaAustriaBahamasBangladeshBarbadosBelarusBelgiumBelizeBoliviaBosnia and HerzegovinaBrazilBulgariaBurma/MyanmarCabo VerdeCambodiaCameroonCanadaCaribbeanCentral AmericaChileChinaColombiaCongoCosta RicaCroatiaCubaCzechoslovakiaDenmarkDominicaDominican RepublicEastern AfricaEastern AsiaEastern EuropeEcuadorEgyptEl SalvadorEnglandEritreaEthiopiaEuropeFijiFranceGermanyGhanaGreeceGrenadaGuatemalaGuyanaHaitiHondurasHong KongHungaryIndiaIndonesiaIranIraqIrelandIsraelItalyJamaicaJapanJordanKazakhstanKenyaKoreaKuwaitLaosLatin AmericaLatviaLebanonLiberiaLithuaniaMalaysiaMexicoMicronesiaMiddle AfricaMoldovaMoroccoNepalNetherlandsNicaraguaNigeriaNorth AmericaNorth MacedoniaNorthern AfricaNorthern EuropeNorwayOceaniaPakistanPanamaPeruPhilippinesPolandPortugalRomaniaRussiaSaudi ArabiaScotlandSenegalSerbiaSierra LeoneSingaporeSomaliaSouth AfricaSouth AmericaSouth Central AsiaSouth Eastern AsiaSouthern EuropeSpainSri LankaSt. Vincent and the GrenadinesSudanSwedenSwitzerlandSyriaTaiwanThailandTrinidad and TobagoTurkeyUgandaUkraineUruguayUzbekistanVenezuelaVietnamWest IndiesWestern AsiaWestern EuropeYemenZaireZimbabweAzores
Immigrants from Western Africa
Race
Ancestry
AfghanAfricanAlaska NativeAlaskan AthabascanAlbanianAleutAlsatianAmericanApacheArabArapahoArgentineanArmenianAssyrian/Chaldean/SyriacAustralianAustrianBahamianBangladeshiBarbadianBasqueBelgianBelizeanBermudanBhutaneseBlackfeetBolivianBrazilianBritishBritish West IndianBulgarianBurmeseCajunCambodianCanadianCape VerdeanCarpatho RusynCelticCentral AmericanCentral American IndianCherokeeCheyenneChickasawChileanChineseChippewaChoctawColombianColvilleComancheCosta RicanCreeCreekCroatianCrowCubanCypriotCzechCzechoslovakianDanishDelawareDominicanDutchDutch West IndianEastern EuropeanEcuadorianEgyptianEnglishEstonianEthiopianEuropeanFijianFilipinoFinnishFrenchFrench American IndianFrench CanadianGermanGerman RussianGhanaianGreekGuamanian/ChamorroGuatemalanGuyaneseHaitianHmongHonduranHopiHoumaHungarianIcelanderIndian (Asian)IndonesianInupiatIranianIraqiIrishIroquoisIsraeliItalianJamaicanJapaneseJordanianKenyanKiowaKoreanLaotianLatvianLebaneseLiberianLithuanianLumbeeLuxembourgerMacedonianMalaysianMalteseMarshalleseMexicanMexican American IndianMongolianMoroccanNative HawaiianNavajoNepaleseNicaraguanNigerianNorthern EuropeanNorwegianOkinawanOsageOttawaPaiutePakistaniPalestinianPanamanianParaguayanPennsylvania GermanPeruvianPimaPolishPortuguesePotawatomiPuebloPuerto RicanPuget Sound SalishRomanianRussianSalvadoranSamoanScandinavianScotch-IrishScottishSeminoleSenegaleseSerbianShoshoneSierra LeoneanSiouxSlavicSlovakSloveneSomaliSouth AfricanSouth AmericanSouth American IndianSoviet UnionSpaniardSpanishSpanish AmericanSpanish American IndianSri LankanSubsaharan AfricanSudaneseSwedishSwissSyrianTaiwaneseThaiTlingit-HaidaTohono O'OdhamTonganTrinidadian and TobagonianTsimshianTurkishU.S. Virgin IslanderUgandanUkrainianUruguayanUteVenezuelanVietnameseWelshWest IndianYakamaYaquiYugoslavianYumanYup'ikZimbabwean
Immigration
NonimmigrantsImmigrantsAfghanistanAfricaAlbaniaArgentinaArmeniaAsiaAustraliaAustriaBahamasBangladeshBarbadosBelarusBelgiumBelizeBoliviaBosnia and HerzegovinaBrazilBulgariaBurma/MyanmarCabo VerdeCambodiaCameroonCanadaCaribbeanCentral AmericaChileChinaColombiaCongoCosta RicaCroatiaCubaCzechoslovakiaDenmarkDominicaDominican RepublicEastern AfricaEastern AsiaEastern EuropeEcuadorEgyptEl SalvadorEnglandEritreaEthiopiaEuropeFijiFranceGermanyGhanaGreeceGrenadaGuatemalaGuyanaHaitiHondurasHong KongHungaryIndiaIndonesiaIranIraqIrelandIsraelItalyJamaicaJapanJordanKazakhstanKenyaKoreaKuwaitLaosLatin AmericaLatviaLebanonLiberiaLithuaniaMalaysiaMexicoMicronesiaMiddle AfricaMoldovaMoroccoNepalNetherlandsNicaraguaNigeriaNorth AmericaNorth MacedoniaNorthern AfricaNorthern EuropeNorwayOceaniaPakistanPanamaPeruPhilippinesPolandPortugalRomaniaRussiaSaudi ArabiaScotlandSenegalSerbiaSierra LeoneSingaporeSomaliaSouth AfricaSouth AmericaSouth Central AsiaSouth Eastern AsiaSouthern EuropeSpainSri LankaSt. Vincent and the GrenadinesSudanSwedenSwitzerlandSyriaTaiwanThailandTrinidad and TobagoTurkeyUgandaUkraineUruguayUzbekistanVenezuelaVietnamWest IndiesWestern AfricaWestern AsiaWestern EuropeYemenZaireZimbabweAzores
Unemployment Among Seniors over 75 years
Income
Poverty
Unemployment
Labor Participation
Family Structure
Vehicle Availability
Education Level
Disability

Unemployment Among Seniors over 75 years Comparison

New Zealanders

Immigrants from Western Africa

Exceptional
Tragic
8.1%
UNEMPLOYMENT AMONG SENIORS OVER 75 YEARS
99.5/ 100
METRIC RATING
88th/ 347
METRIC RANK
9.8%
UNEMPLOYMENT AMONG SENIORS OVER 75 YEARS
0.0/ 100
METRIC RATING
292nd/ 347
METRIC RANK

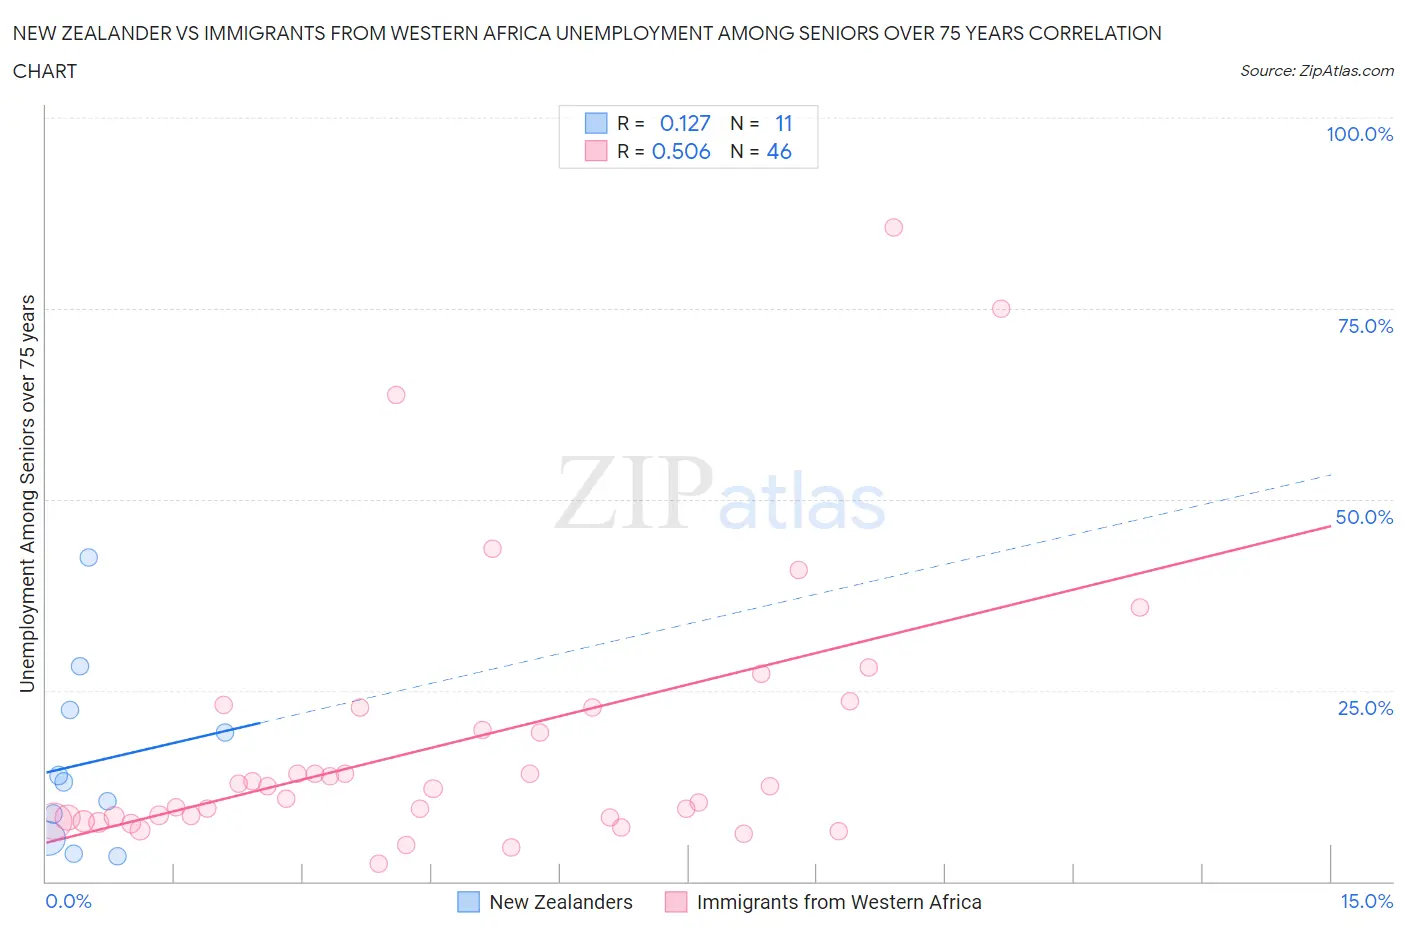
New Zealander vs Immigrants from Western Africa Unemployment Among Seniors over 75 years Correlation Chart

The statistical analysis conducted on geographies consisting of 82,204,458 people shows a poor positive correlation between the proportion of New Zealanders and unemployment rate among seniors over the age of 75 in the United States with a correlation coefficient (R) of 0.127 and weighted average of 8.1%. Similarly, the statistical analysis conducted on geographies consisting of 186,734,228 people shows a substantial positive correlation between the proportion of Immigrants from Western Africa and unemployment rate among seniors over the age of 75 in the United States with a correlation coefficient (R) of 0.506 and weighted average of 9.8%, a difference of 20.4%.
New Zealander vs Immigrants from Western Africa Unemployment Among Seniors over 75 years

Unemployment Among Seniors over 75 years Correlation Summary

MeasurementNew ZealanderImmigrants from Western Africa
Minimum3.2%2.3%
Maximum42.5%85.5%
Range39.3%83.2%
Mean15.6%18.2%
Median13.0%12.3%
Interquartile 25% (IQ1)5.6%8.3%
Interquartile 75% (IQ3)22.4%22.7%
Interquartile Range (IQR)16.8%14.4%
Standard Deviation (Sample)11.9%17.8%
Standard Deviation (Population)11.4%17.6%

Similar Demographics by Unemployment Among Seniors over 75 years

Demographics Similar to New Zealanders by Unemployment Among Seniors over 75 years

In terms of unemployment among seniors over 75 years, the demographic groups most similar to New Zealanders are Immigrants from Korea (8.1%, a difference of 0.010%), Basque (8.1%, a difference of 0.040%), Immigrants from Vietnam (8.1%, a difference of 0.090%), Egyptian (8.1%, a difference of 0.13%), and Venezuelan (8.1%, a difference of 0.13%).
DemographicsRating | RankUnemployment Among Seniors over 75 years
Cubans
99.7
/100
|
#81
Exceptional
8.0%
Bhutanese
99.7
/100
|
#82
Exceptional
8.0%
Arapaho
99.7
/100
|
#83
Exceptional
8.1%
U.S. Virgin Islanders
99.7
/100
|
#84
Exceptional
8.1%
Immigrants | Indonesia
99.7
/100
|
#85
Exceptional
8.1%
Immigrants | Singapore
99.7
/100
|
#86
Exceptional
8.1%
Basques
99.5
/100
|
#87
Exceptional
8.1%
New Zealanders
99.5
/100
|
#88
Exceptional
8.1%
Immigrants | Korea
99.5
/100
|
#89
Exceptional
8.1%
Immigrants | Vietnam
99.5
/100
|
#90
Exceptional
8.1%
Egyptians
99.5
/100
|
#91
Exceptional
8.1%
Venezuelans
99.5
/100
|
#92
Exceptional
8.1%
Immigrants | Netherlands
99.5
/100
|
#93
Exceptional
8.1%
Immigrants | Ireland
99.4
/100
|
#94
Exceptional
8.1%
Nicaraguans
99.3
/100
|
#95
Exceptional
8.2%

Demographics Similar to Immigrants from Western Africa by Unemployment Among Seniors over 75 years

In terms of unemployment among seniors over 75 years, the demographic groups most similar to Immigrants from Western Africa are Norwegian (9.8%, a difference of 0.17%), Immigrants from Dominica (9.8%, a difference of 0.23%), Scandinavian (9.7%, a difference of 0.29%), Nonimmigrants (9.8%, a difference of 0.59%), and Immigrants from St. Vincent and the Grenadines (9.8%, a difference of 0.64%).
DemographicsRating | RankUnemployment Among Seniors over 75 years
Carpatho Rusyns
0.0
/100
|
#285
Tragic
9.7%
Nigerians
0.0
/100
|
#286
Tragic
9.7%
Danes
0.0
/100
|
#287
Tragic
9.7%
Canadians
0.0
/100
|
#288
Tragic
9.7%
Czechs
0.0
/100
|
#289
Tragic
9.7%
Sioux
0.0
/100
|
#290
Tragic
9.7%
Scandinavians
0.0
/100
|
#291
Tragic
9.7%
Immigrants | Western Africa
0.0
/100
|
#292
Tragic
9.8%
Norwegians
0.0
/100
|
#293
Tragic
9.8%
Immigrants | Dominica
0.0
/100
|
#294
Tragic
9.8%
Immigrants | Nonimmigrants
0.0
/100
|
#295
Tragic
9.8%
Immigrants | St. Vincent and the Grenadines
0.0
/100
|
#296
Tragic
9.8%
Cherokee
0.0
/100
|
#297
Tragic
9.8%
Lithuanians
0.0
/100
|
#298
Tragic
9.9%
Belgians
0.0
/100
|
#299
Tragic
9.9%