Inupiat vs Estonian Unemployment Among Ages 60 to 64 years
COMPARE
Inupiat
Estonian
Unemployment Among Ages 60 to 64 years
Unemployment Among Ages 60 to 64 years Comparison
Inupiat
Estonians
9.6%
UNEMPLOYMENT AMONG AGES 60 TO 64 YEARS
0.0/ 100
METRIC RATING
346th/ 347
METRIC RANK
5.1%
UNEMPLOYMENT AMONG AGES 60 TO 64 YEARS
0.8/ 100
METRIC RATING
255th/ 347
METRIC RANK
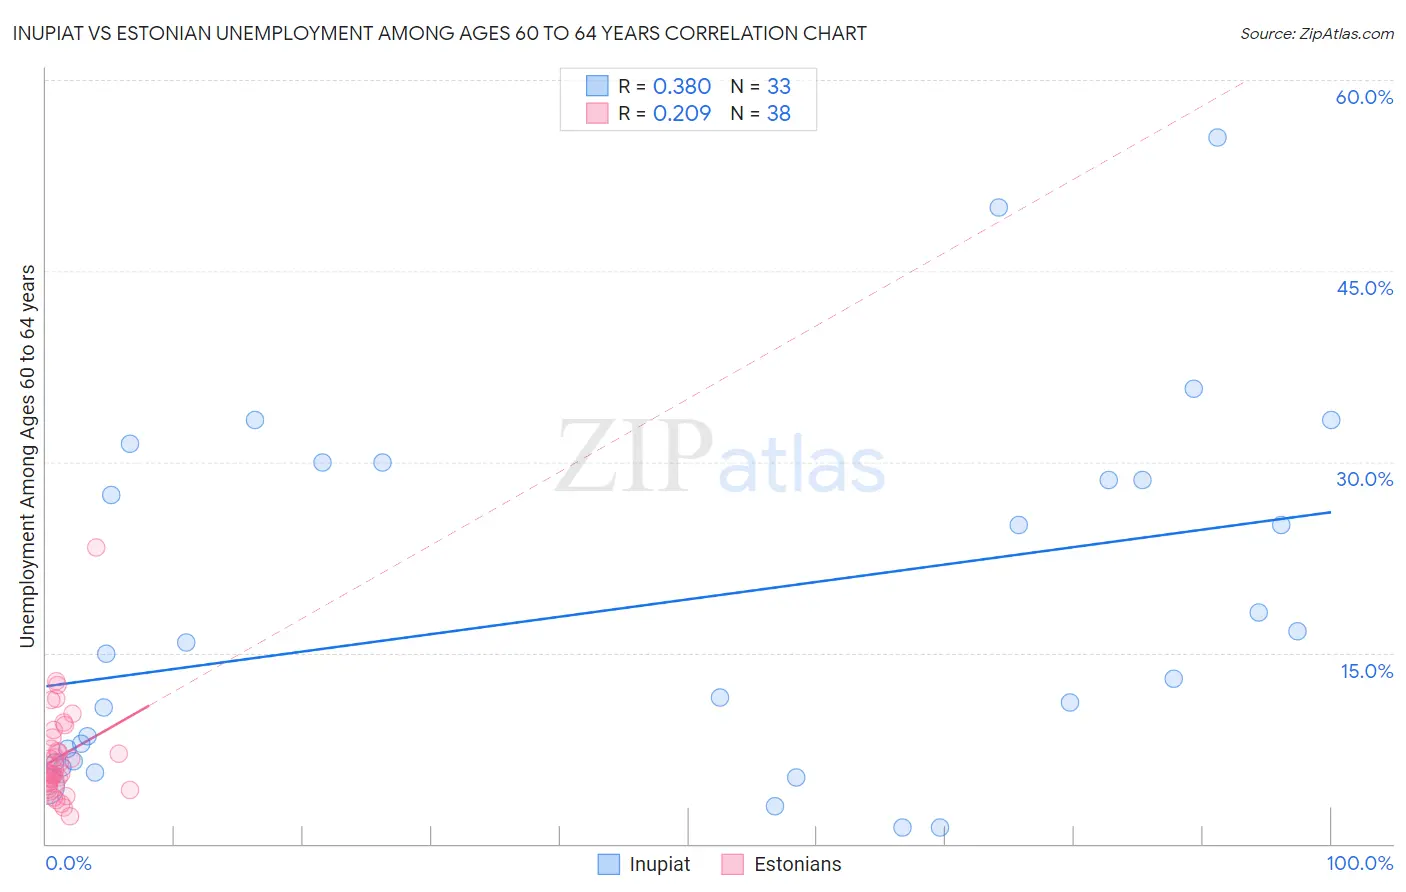
Inupiat vs Estonian Unemployment Among Ages 60 to 64 years Correlation Chart
The statistical analysis conducted on geographies consisting of 92,796,464 people shows a mild positive correlation between the proportion of Inupiat and unemployment rate among population between the ages 60 and 64 in the United States with a correlation coefficient (R) of 0.380 and weighted average of 9.6%. Similarly, the statistical analysis conducted on geographies consisting of 118,962,162 people shows a weak positive correlation between the proportion of Estonians and unemployment rate among population between the ages 60 and 64 in the United States with a correlation coefficient (R) of 0.209 and weighted average of 5.1%, a difference of 89.1%.
Unemployment Among Ages 60 to 64 years Correlation Summary
| Measurement | Inupiat | Estonian |
| Minimum | 1.3% | 2.2% |
| Maximum | 55.5% | 23.3% |
| Range | 54.2% | 21.1% |
| Mean | 18.5% | 6.9% |
| Median | 14.9% | 5.6% |
| Interquartile 25% (IQ1) | 6.5% | 4.8% |
| Interquartile 75% (IQ3) | 29.3% | 8.3% |
| Interquartile Range (IQR) | 22.8% | 3.6% |
| Standard Deviation (Sample) | 14.0% | 3.8% |
| Standard Deviation (Population) | 13.8% | 3.8% |
Similar Demographics by Unemployment Among Ages 60 to 64 years
Demographics Similar to Inupiat by Unemployment Among Ages 60 to 64 years
In terms of unemployment among ages 60 to 64 years, the demographic groups most similar to Inupiat are Alaskan Athabascan (8.4%, a difference of 14.2%), Yup'ik (11.9%, a difference of 24.4%), Alaska Native (7.6%, a difference of 25.6%), Immigrants from Yemen (6.8%, a difference of 40.3%), and Aleut (6.8%, a difference of 41.3%).
| Demographics | Rating | Rank | Unemployment Among Ages 60 to 64 years |
| Immigrants | Dominican Republic | 0.0 /100 | #333 | Tragic 6.0% |
| Puerto Ricans | 0.0 /100 | #334 | Tragic 6.1% |
| Vietnamese | 0.0 /100 | #335 | Tragic 6.1% |
| Kiowa | 0.0 /100 | #336 | Tragic 6.2% |
| Navajo | 0.0 /100 | #337 | Tragic 6.3% |
| Arapaho | 0.0 /100 | #338 | Tragic 6.3% |
| Tlingit-Haida | 0.0 /100 | #339 | Tragic 6.4% |
| Pueblo | 0.0 /100 | #340 | Tragic 6.7% |
| Yuman | 0.0 /100 | #341 | Tragic 6.8% |
| Aleuts | 0.0 /100 | #342 | Tragic 6.8% |
| Immigrants | Yemen | 0.0 /100 | #343 | Tragic 6.8% |
| Alaska Natives | 0.0 /100 | #344 | Tragic 7.6% |
| Alaskan Athabascans | 0.0 /100 | #345 | Tragic 8.4% |
| Inupiat | 0.0 /100 | #346 | Tragic 9.6% |
| Yup'ik | 0.0 /100 | #347 | Tragic 11.9% |
Demographics Similar to Estonians by Unemployment Among Ages 60 to 64 years
In terms of unemployment among ages 60 to 64 years, the demographic groups most similar to Estonians are Costa Rican (5.1%, a difference of 0.010%), Immigrants from China (5.1%, a difference of 0.040%), Immigrants from Switzerland (5.1%, a difference of 0.080%), Immigrants from Uruguay (5.1%, a difference of 0.090%), and Immigrants from Peru (5.1%, a difference of 0.12%).
| Demographics | Rating | Rank | Unemployment Among Ages 60 to 64 years |
| Immigrants | Fiji | 1.1 /100 | #248 | Tragic 5.1% |
| South Americans | 1.0 /100 | #249 | Tragic 5.1% |
| Immigrants | Cambodia | 0.9 /100 | #250 | Tragic 5.1% |
| Immigrants | Uruguay | 0.9 /100 | #251 | Tragic 5.1% |
| Immigrants | Switzerland | 0.9 /100 | #252 | Tragic 5.1% |
| Immigrants | China | 0.9 /100 | #253 | Tragic 5.1% |
| Costa Ricans | 0.8 /100 | #254 | Tragic 5.1% |
| Estonians | 0.8 /100 | #255 | Tragic 5.1% |
| Immigrants | Peru | 0.7 /100 | #256 | Tragic 5.1% |
| Japanese | 0.6 /100 | #257 | Tragic 5.1% |
| Celtics | 0.5 /100 | #258 | Tragic 5.1% |
| Hondurans | 0.5 /100 | #259 | Tragic 5.1% |
| Immigrants | Honduras | 0.4 /100 | #260 | Tragic 5.1% |
| Immigrants | Ghana | 0.4 /100 | #261 | Tragic 5.1% |
| Immigrants | Uzbekistan | 0.4 /100 | #262 | Tragic 5.1% |