Hungarian vs Estonian Unemployment Among Ages 60 to 64 years
COMPARE
Hungarian
Estonian
Unemployment Among Ages 60 to 64 years
Unemployment Among Ages 60 to 64 years Comparison
Hungarians
Estonians
4.9%
UNEMPLOYMENT AMONG AGES 60 TO 64 YEARS
40.6/ 100
METRIC RATING
181st/ 347
METRIC RANK
5.1%
UNEMPLOYMENT AMONG AGES 60 TO 64 YEARS
0.8/ 100
METRIC RATING
255th/ 347
METRIC RANK
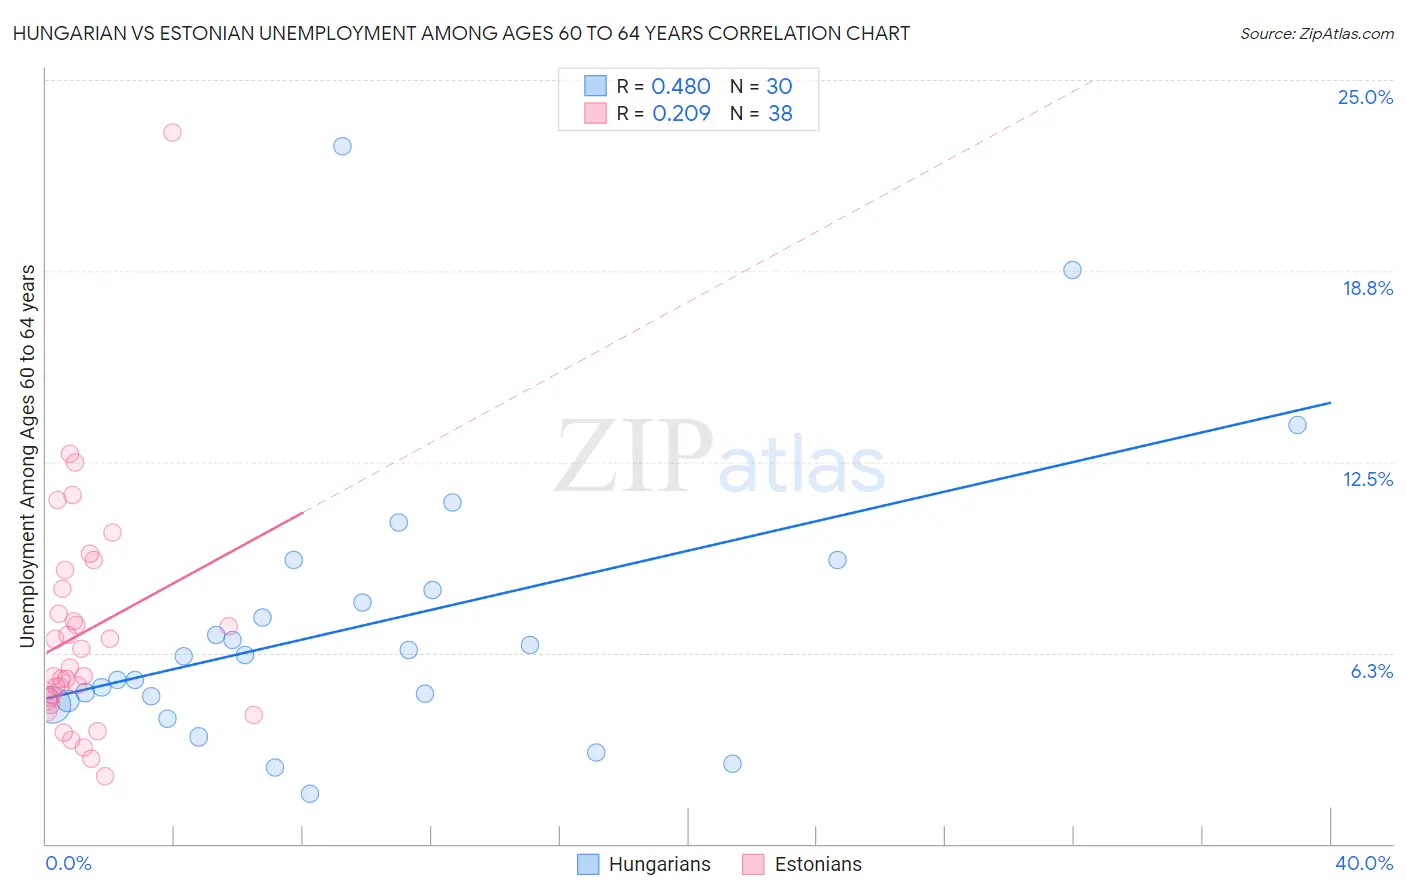
Hungarian vs Estonian Unemployment Among Ages 60 to 64 years Correlation Chart
The statistical analysis conducted on geographies consisting of 421,292,514 people shows a moderate positive correlation between the proportion of Hungarians and unemployment rate among population between the ages 60 and 64 in the United States with a correlation coefficient (R) of 0.480 and weighted average of 4.9%. Similarly, the statistical analysis conducted on geographies consisting of 118,962,162 people shows a weak positive correlation between the proportion of Estonians and unemployment rate among population between the ages 60 and 64 in the United States with a correlation coefficient (R) of 0.209 and weighted average of 5.1%, a difference of 3.9%.
Unemployment Among Ages 60 to 64 years Correlation Summary
| Measurement | Hungarian | Estonian |
| Minimum | 1.7% | 2.2% |
| Maximum | 22.8% | 23.3% |
| Range | 21.2% | 21.1% |
| Mean | 7.2% | 6.9% |
| Median | 6.1% | 5.6% |
| Interquartile 25% (IQ1) | 4.7% | 4.8% |
| Interquartile 75% (IQ3) | 8.3% | 8.3% |
| Interquartile Range (IQR) | 3.6% | 3.6% |
| Standard Deviation (Sample) | 4.6% | 3.8% |
| Standard Deviation (Population) | 4.5% | 3.8% |
Similar Demographics by Unemployment Among Ages 60 to 64 years
Demographics Similar to Hungarians by Unemployment Among Ages 60 to 64 years
In terms of unemployment among ages 60 to 64 years, the demographic groups most similar to Hungarians are Asian (4.9%, a difference of 0.0%), Sri Lankan (4.9%, a difference of 0.030%), Subsaharan African (4.9%, a difference of 0.070%), Immigrants from Ukraine (4.9%, a difference of 0.11%), and Ute (4.9%, a difference of 0.12%).
| Demographics | Rating | Rank | Unemployment Among Ages 60 to 64 years |
| Immigrants | Western Europe | 50.0 /100 | #174 | Average 4.9% |
| Immigrants | Latvia | 46.9 /100 | #175 | Average 4.9% |
| Bermudans | 46.5 /100 | #176 | Average 4.9% |
| Immigrants | Malaysia | 44.7 /100 | #177 | Average 4.9% |
| Immigrants | Nonimmigrants | 44.5 /100 | #178 | Average 4.9% |
| Immigrants | Sweden | 44.3 /100 | #179 | Average 4.9% |
| Asians | 40.8 /100 | #180 | Average 4.9% |
| Hungarians | 40.6 /100 | #181 | Average 4.9% |
| Sri Lankans | 39.8 /100 | #182 | Fair 4.9% |
| Sub-Saharan Africans | 38.9 /100 | #183 | Fair 4.9% |
| Immigrants | Ukraine | 37.6 /100 | #184 | Fair 4.9% |
| Ute | 37.4 /100 | #185 | Fair 4.9% |
| Spaniards | 35.8 /100 | #186 | Fair 4.9% |
| South American Indians | 31.2 /100 | #187 | Fair 4.9% |
| Nicaraguans | 30.4 /100 | #188 | Fair 4.9% |
Demographics Similar to Estonians by Unemployment Among Ages 60 to 64 years
In terms of unemployment among ages 60 to 64 years, the demographic groups most similar to Estonians are Costa Rican (5.1%, a difference of 0.010%), Immigrants from China (5.1%, a difference of 0.040%), Immigrants from Switzerland (5.1%, a difference of 0.080%), Immigrants from Uruguay (5.1%, a difference of 0.090%), and Immigrants from Peru (5.1%, a difference of 0.12%).
| Demographics | Rating | Rank | Unemployment Among Ages 60 to 64 years |
| Immigrants | Fiji | 1.1 /100 | #248 | Tragic 5.1% |
| South Americans | 1.0 /100 | #249 | Tragic 5.1% |
| Immigrants | Cambodia | 0.9 /100 | #250 | Tragic 5.1% |
| Immigrants | Uruguay | 0.9 /100 | #251 | Tragic 5.1% |
| Immigrants | Switzerland | 0.9 /100 | #252 | Tragic 5.1% |
| Immigrants | China | 0.9 /100 | #253 | Tragic 5.1% |
| Costa Ricans | 0.8 /100 | #254 | Tragic 5.1% |
| Estonians | 0.8 /100 | #255 | Tragic 5.1% |
| Immigrants | Peru | 0.7 /100 | #256 | Tragic 5.1% |
| Japanese | 0.6 /100 | #257 | Tragic 5.1% |
| Celtics | 0.5 /100 | #258 | Tragic 5.1% |
| Hondurans | 0.5 /100 | #259 | Tragic 5.1% |
| Immigrants | Honduras | 0.4 /100 | #260 | Tragic 5.1% |
| Immigrants | Ghana | 0.4 /100 | #261 | Tragic 5.1% |
| Immigrants | Uzbekistan | 0.4 /100 | #262 | Tragic 5.1% |