Immigrants from Ireland vs Immigrants from Ukraine Unemployment Among Ages 20 to 24 years
COMPARE
Immigrants from Ireland
Immigrants from Ukraine
Unemployment Among Ages 20 to 24 years
Unemployment Among Ages 20 to 24 years Comparison
Immigrants from Ireland
Immigrants from Ukraine
11.1%
UNEMPLOYMENT AMONG AGES 20 TO 24 YEARS
0.0/ 100
METRIC RATING
265th/ 347
METRIC RANK
10.6%
UNEMPLOYMENT AMONG AGES 20 TO 24 YEARS
3.3/ 100
METRIC RATING
235th/ 347
METRIC RANK
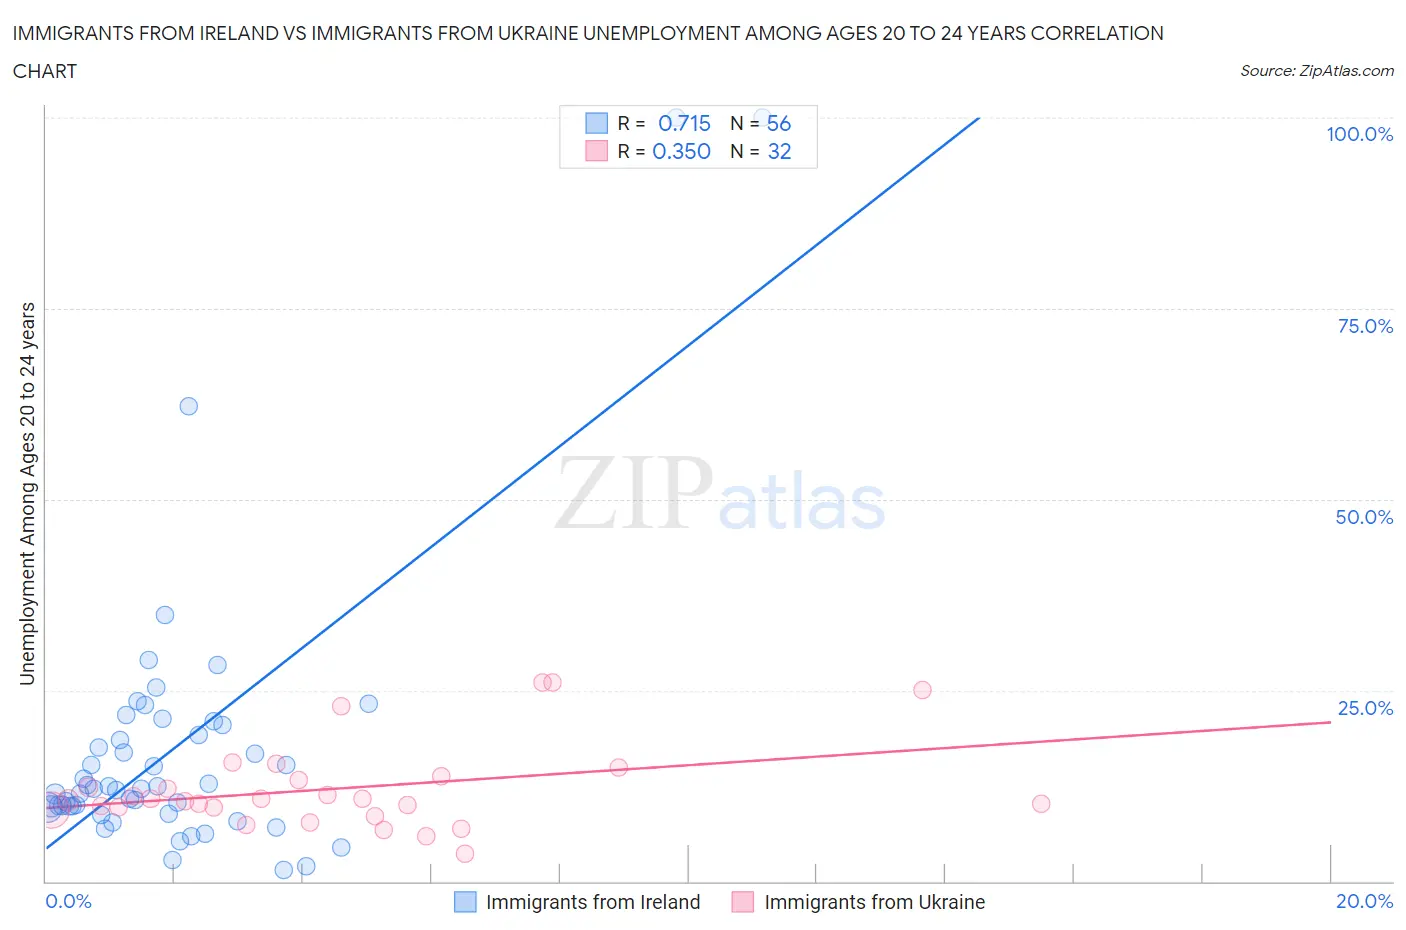
Immigrants from Ireland vs Immigrants from Ukraine Unemployment Among Ages 20 to 24 years Correlation Chart
The statistical analysis conducted on geographies consisting of 235,644,442 people shows a strong positive correlation between the proportion of Immigrants from Ireland and unemployment rate among population between the ages 20 and 24 in the United States with a correlation coefficient (R) of 0.715 and weighted average of 11.1%. Similarly, the statistical analysis conducted on geographies consisting of 283,499,162 people shows a mild positive correlation between the proportion of Immigrants from Ukraine and unemployment rate among population between the ages 20 and 24 in the United States with a correlation coefficient (R) of 0.350 and weighted average of 10.6%, a difference of 4.3%.
Unemployment Among Ages 20 to 24 years Correlation Summary
| Measurement | Immigrants from Ireland | Immigrants from Ukraine |
| Minimum | 1.4% | 3.6% |
| Maximum | 100.0% | 26.0% |
| Range | 98.6% | 22.4% |
| Mean | 17.4% | 12.1% |
| Median | 12.1% | 10.7% |
| Interquartile 25% (IQ1) | 9.7% | 9.5% |
| Interquartile 75% (IQ3) | 19.9% | 13.5% |
| Interquartile Range (IQR) | 10.1% | 4.1% |
| Standard Deviation (Sample) | 18.7% | 5.6% |
| Standard Deviation (Population) | 18.5% | 5.5% |
Similar Demographics by Unemployment Among Ages 20 to 24 years
Demographics Similar to Immigrants from Ireland by Unemployment Among Ages 20 to 24 years
In terms of unemployment among ages 20 to 24 years, the demographic groups most similar to Immigrants from Ireland are Subsaharan African (11.1%, a difference of 0.070%), Immigrants from Liberia (11.1%, a difference of 0.090%), Immigrants from Greece (11.1%, a difference of 0.37%), Marshallese (11.0%, a difference of 0.82%), and Maltese (11.2%, a difference of 0.82%).
| Demographics | Rating | Rank | Unemployment Among Ages 20 to 24 years |
| Dutch West Indians | 0.3 /100 | #258 | Tragic 10.9% |
| Panamanians | 0.2 /100 | #259 | Tragic 10.9% |
| Immigrants | Lebanon | 0.2 /100 | #260 | Tragic 10.9% |
| Puget Sound Salish | 0.2 /100 | #261 | Tragic 10.9% |
| Immigrants | Latin America | 0.1 /100 | #262 | Tragic 11.0% |
| Marshallese | 0.1 /100 | #263 | Tragic 11.0% |
| Sub-Saharan Africans | 0.0 /100 | #264 | Tragic 11.1% |
| Immigrants | Ireland | 0.0 /100 | #265 | Tragic 11.1% |
| Immigrants | Liberia | 0.0 /100 | #266 | Tragic 11.1% |
| Immigrants | Greece | 0.0 /100 | #267 | Tragic 11.1% |
| Maltese | 0.0 /100 | #268 | Tragic 11.2% |
| Ute | 0.0 /100 | #269 | Tragic 11.2% |
| Delaware | 0.0 /100 | #270 | Tragic 11.3% |
| Immigrants | Uzbekistan | 0.0 /100 | #271 | Tragic 11.4% |
| Nigerians | 0.0 /100 | #272 | Tragic 11.4% |
Demographics Similar to Immigrants from Ukraine by Unemployment Among Ages 20 to 24 years
In terms of unemployment among ages 20 to 24 years, the demographic groups most similar to Immigrants from Ukraine are Mexican (10.6%, a difference of 0.040%), Immigrants from Africa (10.6%, a difference of 0.050%), Choctaw (10.6%, a difference of 0.060%), Israeli (10.6%, a difference of 0.090%), and Native Hawaiian (10.6%, a difference of 0.14%).
| Demographics | Rating | Rank | Unemployment Among Ages 20 to 24 years |
| Mexican American Indians | 4.6 /100 | #228 | Tragic 10.6% |
| Americans | 4.4 /100 | #229 | Tragic 10.6% |
| French American Indians | 4.1 /100 | #230 | Tragic 10.6% |
| Native Hawaiians | 3.9 /100 | #231 | Tragic 10.6% |
| Israelis | 3.7 /100 | #232 | Tragic 10.6% |
| Choctaw | 3.6 /100 | #233 | Tragic 10.6% |
| Immigrants | Africa | 3.5 /100 | #234 | Tragic 10.6% |
| Immigrants | Ukraine | 3.3 /100 | #235 | Tragic 10.6% |
| Mexicans | 3.2 /100 | #236 | Tragic 10.6% |
| Immigrants | Immigrants | 2.7 /100 | #237 | Tragic 10.6% |
| Immigrants | Pakistan | 2.6 /100 | #238 | Tragic 10.6% |
| Salvadorans | 2.4 /100 | #239 | Tragic 10.7% |
| Immigrants | Central America | 2.0 /100 | #240 | Tragic 10.7% |
| Immigrants | El Salvador | 1.7 /100 | #241 | Tragic 10.7% |
| Moroccans | 1.4 /100 | #242 | Tragic 10.7% |