Native/Alaskan vs Tlingit-Haida Female Unemployment

COMPARE

Native/Alaskan
Race
Ancestry
AfghanAfricanAlaska NativeAlaskan AthabascanAlbanianAleutAlsatianAmericanApacheArabArapahoArgentineanArmenianAssyrian/Chaldean/SyriacAustralianAustrianBahamianBangladeshiBarbadianBasqueBelgianBelizeanBermudanBhutaneseBlackfeetBolivianBrazilianBritishBritish West IndianBulgarianBurmeseCajunCambodianCanadianCape VerdeanCarpatho RusynCelticCentral AmericanCentral American IndianCherokeeCheyenneChickasawChileanChineseChippewaChoctawColombianColvilleComancheCosta RicanCreeCreekCroatianCrowCubanCypriotCzechCzechoslovakianDanishDelawareDominicanDutchDutch West IndianEastern EuropeanEcuadorianEgyptianEnglishEstonianEthiopianEuropeanFijianFilipinoFinnishFrenchFrench American IndianFrench CanadianGermanGerman RussianGhanaianGreekGuamanian/ChamorroGuatemalanGuyaneseHaitianHmongHonduranHopiHoumaHungarianIcelanderIndian (Asian)IndonesianInupiatIranianIraqiIrishIroquoisIsraeliItalianJamaicanJapaneseJordanianKenyanKiowaKoreanLaotianLatvianLebaneseLiberianLithuanianLumbeeLuxembourgerMacedonianMalaysianMalteseMarshalleseMenomineeMexicanMexican American IndianMongolianMoroccanNative HawaiianNavajoNepaleseNew ZealanderNicaraguanNigerianNorthern EuropeanNorwegianOkinawanOsageOttawaPaiutePakistaniPalestinianPanamanianParaguayanPennsylvania GermanPeruvianPimaPolishPortuguesePotawatomiPuebloPuerto RicanPuget Sound SalishRomanianRussianSalvadoranSamoanScandinavianScotch-IrishScottishSeminoleSenegaleseSerbianShoshoneSierra LeoneanSiouxSlavicSlovakSloveneSomaliSouth AfricanSouth AmericanSouth American IndianSoviet UnionSpaniardSpanishSpanish AmericanSpanish American IndianSri LankanSubsaharan AfricanSudaneseSwedishSwissSyrianTaiwaneseThaiTohono O'OdhamTonganTrinidadian and TobagonianTsimshianTurkishU.S. Virgin IslanderUgandanUkrainianUruguayanUteVenezuelanVietnameseWelshWest IndianYakamaYaquiYugoslavianYumanYup'ikZimbabwean
Immigration
NonimmigrantsImmigrantsAfghanistanAfricaAlbaniaArgentinaArmeniaAsiaAustraliaAustriaBahamasBangladeshBarbadosBelarusBelgiumBelizeBoliviaBosnia and HerzegovinaBrazilBulgariaBurma/MyanmarCabo VerdeCambodiaCameroonCanadaCaribbeanCentral AmericaChileChinaColombiaCongoCosta RicaCroatiaCubaCzechoslovakiaDenmarkDominicaDominican RepublicEastern AfricaEastern AsiaEastern EuropeEcuadorEgyptEl SalvadorEnglandEritreaEthiopiaEuropeFijiFranceGermanyGhanaGreeceGrenadaGuatemalaGuyanaHaitiHondurasHong KongHungaryIndiaIndonesiaIranIraqIrelandIsraelItalyJamaicaJapanJordanKazakhstanKenyaKoreaKuwaitLaosLatin AmericaLatviaLebanonLiberiaLithuaniaMalaysiaMexicoMicronesiaMiddle AfricaMoldovaMoroccoNepalNetherlandsNicaraguaNigeriaNorth AmericaNorth MacedoniaNorthern AfricaNorthern EuropeNorwayOceaniaPakistanPanamaPeruPhilippinesPolandPortugalRomaniaRussiaSaudi ArabiaScotlandSenegalSerbiaSierra LeoneSingaporeSomaliaSouth AfricaSouth AmericaSouth Central AsiaSouth Eastern AsiaSouthern EuropeSpainSri LankaSt. Vincent and the GrenadinesSudanSwedenSwitzerlandSyriaTaiwanThailandTrinidad and TobagoTurkeyUgandaUkraineUruguayUzbekistanVenezuelaVietnamWest IndiesWestern AfricaWestern AsiaWestern EuropeYemenZaireZimbabweAzores
Tlingit-Haida
Race
Ancestry
AfghanAfricanAlaska NativeAlaskan AthabascanAlbanianAleutAlsatianAmericanApacheArabArapahoArgentineanArmenianAssyrian/Chaldean/SyriacAustralianAustrianBahamianBangladeshiBarbadianBasqueBelgianBelizeanBermudanBhutaneseBlackfeetBolivianBrazilianBritishBritish West IndianBulgarianBurmeseCajunCambodianCanadianCape VerdeanCarpatho RusynCelticCentral AmericanCentral American IndianCherokeeCheyenneChickasawChileanChineseChippewaChoctawColombianColvilleComancheCosta RicanCreeCreekCroatianCrowCubanCypriotCzechCzechoslovakianDanishDelawareDominicanDutchDutch West IndianEastern EuropeanEcuadorianEgyptianEnglishEstonianEthiopianEuropeanFijianFilipinoFinnishFrenchFrench American IndianFrench CanadianGermanGerman RussianGhanaianGreekGuamanian/ChamorroGuatemalanGuyaneseHaitianHmongHonduranHopiHoumaHungarianIcelanderIndian (Asian)IndonesianInupiatIranianIraqiIrishIroquoisIsraeliItalianJamaicanJapaneseJordanianKenyanKiowaKoreanLaotianLatvianLebaneseLiberianLithuanianLumbeeLuxembourgerMacedonianMalaysianMalteseMarshalleseMenomineeMexicanMexican American IndianMongolianMoroccanNative HawaiianNavajoNepaleseNew ZealanderNicaraguanNigerianNorthern EuropeanNorwegianOkinawanOsageOttawaPaiutePakistaniPalestinianPanamanianParaguayanPennsylvania GermanPeruvianPimaPolishPortuguesePotawatomiPuebloPuerto RicanPuget Sound SalishRomanianRussianSalvadoranSamoanScandinavianScotch-IrishScottishSeminoleSenegaleseSerbianShoshoneSierra LeoneanSiouxSlavicSlovakSloveneSomaliSouth AfricanSouth AmericanSouth American IndianSoviet UnionSpaniardSpanishSpanish AmericanSpanish American IndianSri LankanSubsaharan AfricanSudaneseSwedishSwissSyrianTaiwaneseThaiTlingit-HaidaTohono O'OdhamTonganTrinidadian and TobagonianTsimshianTurkishU.S. Virgin IslanderUgandanUkrainianUruguayanUteVenezuelanVietnameseWelshWest IndianYakamaYaquiYugoslavianYumanYup'ikZimbabwean
Immigration
NonimmigrantsImmigrantsAfghanistanAfricaAlbaniaArgentinaArmeniaAsiaAustraliaAustriaBahamasBangladeshBarbadosBelarusBelgiumBelizeBoliviaBosnia and HerzegovinaBrazilBulgariaBurma/MyanmarCabo VerdeCambodiaCameroonCanadaCaribbeanCentral AmericaChileChinaColombiaCongoCosta RicaCroatiaCubaCzechoslovakiaDenmarkDominicaDominican RepublicEastern AfricaEastern AsiaEastern EuropeEcuadorEgyptEl SalvadorEnglandEritreaEthiopiaEuropeFijiFranceGermanyGhanaGreeceGrenadaGuatemalaGuyanaHaitiHondurasHong KongHungaryIndiaIndonesiaIranIraqIrelandIsraelItalyJamaicaJapanJordanKazakhstanKenyaKoreaKuwaitLaosLatin AmericaLatviaLebanonLiberiaLithuaniaMalaysiaMexicoMicronesiaMiddle AfricaMoldovaMoroccoNepalNetherlandsNicaraguaNigeriaNorth AmericaNorth MacedoniaNorthern AfricaNorthern EuropeNorwayOceaniaPakistanPanamaPeruPhilippinesPolandPortugalRomaniaRussiaSaudi ArabiaScotlandSenegalSerbiaSierra LeoneSingaporeSomaliaSouth AfricaSouth AmericaSouth Central AsiaSouth Eastern AsiaSouthern EuropeSpainSri LankaSt. Vincent and the GrenadinesSudanSwedenSwitzerlandSyriaTaiwanThailandTrinidad and TobagoTurkeyUgandaUkraineUruguayUzbekistanVenezuelaVietnamWest IndiesWestern AfricaWestern AsiaWestern EuropeYemenZaireZimbabweAzores
Female Unemployment
Income
Poverty
Unemployment
Labor Participation
Family Structure
Vehicle Availability
Education Level
Disability

Female Unemployment Comparison

Natives/Alaskans

Tlingit-Haida

Tragic
Exceptional
6.6%
FEMALE UNEMPLOYMENT
0.0/ 100
METRIC RATING
326th/ 347
METRIC RANK
4.9%
FEMALE UNEMPLOYMENT
98.3/ 100
METRIC RATING
68th/ 347
METRIC RANK

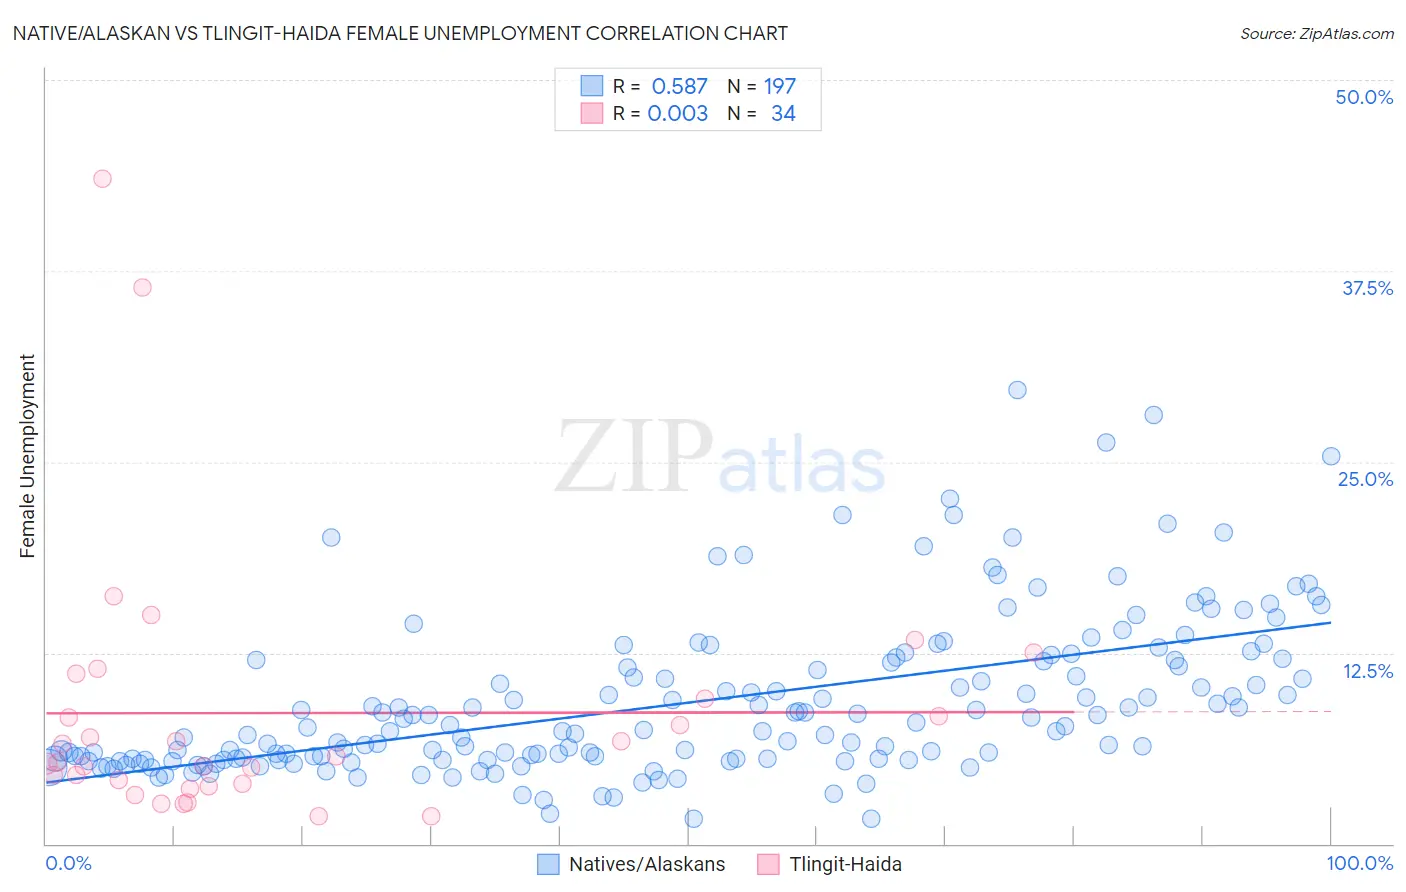
Native/Alaskan vs Tlingit-Haida Female Unemployment Correlation Chart

The statistical analysis conducted on geographies consisting of 506,227,982 people shows a substantial positive correlation between the proportion of Natives/Alaskans and unemploymnet rate among females in the United States with a correlation coefficient (R) of 0.587 and weighted average of 6.6%. Similarly, the statistical analysis conducted on geographies consisting of 60,741,997 people shows no correlation between the proportion of Tlingit-Haida and unemploymnet rate among females in the United States with a correlation coefficient (R) of 0.003 and weighted average of 4.9%, a difference of 34.2%.
Native/Alaskan vs Tlingit-Haida Female Unemployment

Female Unemployment Correlation Summary

MeasurementNative/AlaskanTlingit-Haida
Minimum1.6%1.8%
Maximum29.7%43.5%
Range28.1%41.7%
Mean9.2%8.6%
Median7.5%5.5%
Interquartile 25% (IQ1)5.5%3.9%
Interquartile 75% (IQ3)12.0%9.5%
Interquartile Range (IQR)6.5%5.6%
Standard Deviation (Sample)5.2%8.8%
Standard Deviation (Population)5.2%8.7%

Similar Demographics by Female Unemployment

Demographics Similar to Natives/Alaskans by Female Unemployment

In terms of female unemployment, the demographic groups most similar to Natives/Alaskans are Alaska Native (6.6%, a difference of 0.090%), Guyanese (6.7%, a difference of 0.52%), Apache (6.6%, a difference of 0.56%), Cheyenne (6.6%, a difference of 0.83%), and Immigrants from Guyana (6.7%, a difference of 0.89%).
DemographicsRating | RankFemale Unemployment
Immigrants | Bangladesh
0.0
/100
|
#319
Tragic
6.5%
Immigrants | Dominica
0.0
/100
|
#320
Tragic
6.5%
Blacks/African Americans
0.0
/100
|
#321
Tragic
6.5%
Vietnamese
0.0
/100
|
#322
Tragic
6.5%
Immigrants | Belize
0.0
/100
|
#323
Tragic
6.5%
Cheyenne
0.0
/100
|
#324
Tragic
6.6%
Apache
0.0
/100
|
#325
Tragic
6.6%
Natives/Alaskans
0.0
/100
|
#326
Tragic
6.6%
Alaska Natives
0.0
/100
|
#327
Tragic
6.6%
Guyanese
0.0
/100
|
#328
Tragic
6.7%
Immigrants | Guyana
0.0
/100
|
#329
Tragic
6.7%
Yakama
0.0
/100
|
#330
Tragic
6.7%
Paiute
0.0
/100
|
#331
Tragic
6.8%
Sioux
0.0
/100
|
#332
Tragic
7.0%
Menominee
0.0
/100
|
#333
Tragic
7.0%

Demographics Similar to Tlingit-Haida by Female Unemployment

In terms of female unemployment, the demographic groups most similar to Tlingit-Haida are Hungarian (4.9%, a difference of 0.010%), Cuban (4.9%, a difference of 0.010%), Immigrants from Ireland (4.9%, a difference of 0.010%), Immigrants from North America (4.9%, a difference of 0.040%), and Osage (4.9%, a difference of 0.050%).
DemographicsRating | RankFemale Unemployment
Immigrants | Canada
98.6
/100
|
#61
Exceptional
4.9%
Immigrants | Nepal
98.6
/100
|
#62
Exceptional
4.9%
Immigrants | Belgium
98.5
/100
|
#63
Exceptional
4.9%
Celtics
98.5
/100
|
#64
Exceptional
4.9%
Immigrants | North America
98.3
/100
|
#65
Exceptional
4.9%
Hungarians
98.3
/100
|
#66
Exceptional
4.9%
Cubans
98.3
/100
|
#67
Exceptional
4.9%
Tlingit-Haida
98.3
/100
|
#68
Exceptional
4.9%
Immigrants | Ireland
98.2
/100
|
#69
Exceptional
4.9%
Osage
98.2
/100
|
#70
Exceptional
4.9%
German Russians
98.1
/100
|
#71
Exceptional
4.9%
Immigrants | Northern Europe
98.0
/100
|
#72
Exceptional
4.9%
Russians
98.0
/100
|
#73
Exceptional
5.0%
Immigrants | Bolivia
98.0
/100
|
#74
Exceptional
5.0%
Immigrants | Singapore
98.0
/100
|
#75
Exceptional
5.0%