Native/Alaskan vs Tlingit-Haida Unemployment Among Ages 45 to 54 years
COMPARE
Native/Alaskan
Tlingit-Haida
Unemployment Among Ages 45 to 54 years
Unemployment Among Ages 45 to 54 years Comparison
Natives/Alaskans
Tlingit-Haida
6.1%
UNEMPLOYMENT AMONG AGES 45 TO 54 YEARS
0.0/ 100
METRIC RATING
324th/ 347
METRIC RANK
4.7%
UNEMPLOYMENT AMONG AGES 45 TO 54 YEARS
2.3/ 100
METRIC RATING
236th/ 347
METRIC RANK
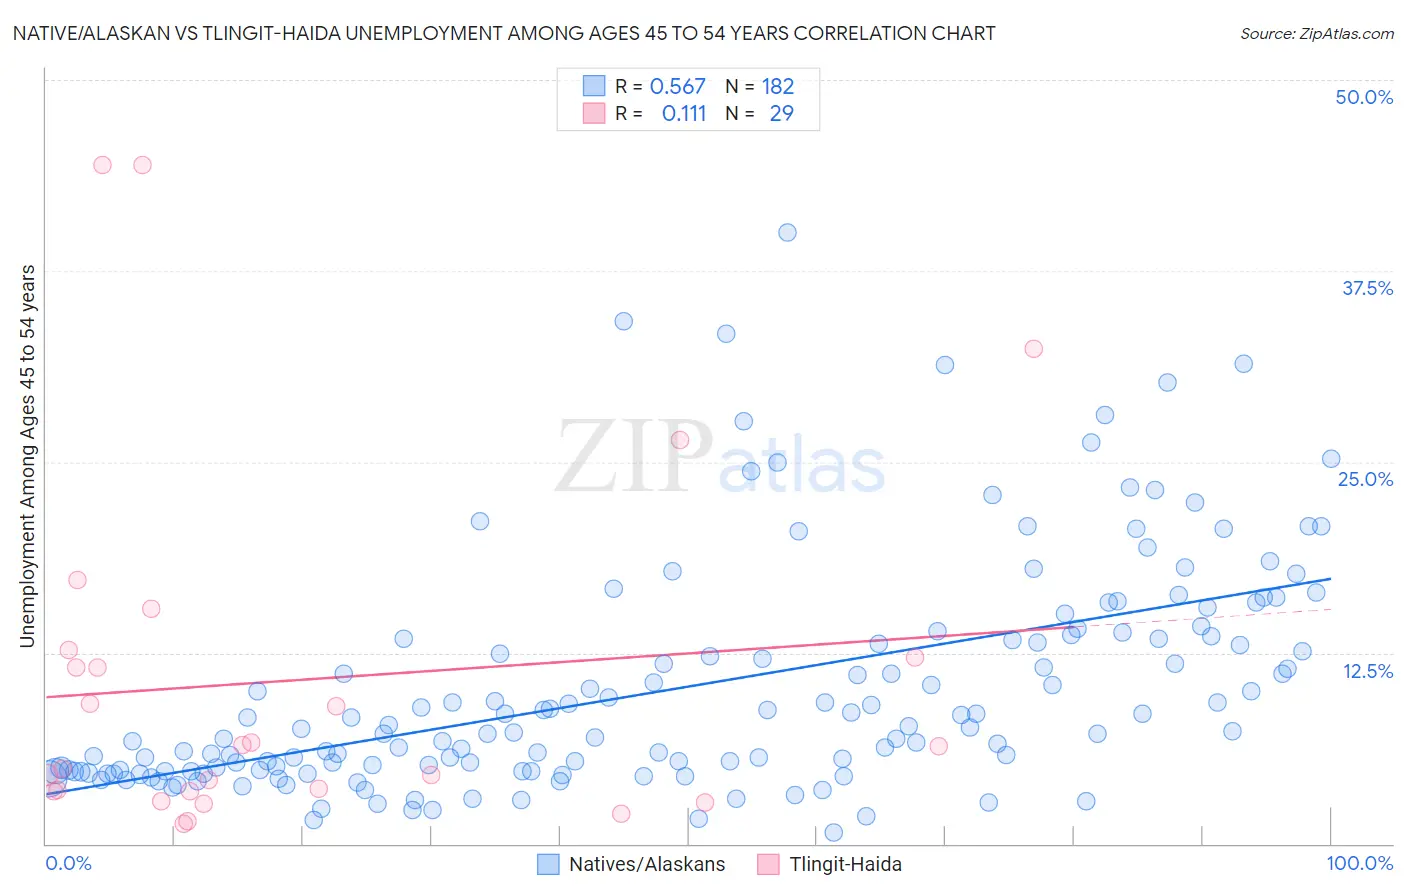
Native/Alaskan vs Tlingit-Haida Unemployment Among Ages 45 to 54 years Correlation Chart
The statistical analysis conducted on geographies consisting of 487,520,360 people shows a substantial positive correlation between the proportion of Natives/Alaskans and unemployment rate among population between the ages 45 and 54 in the United States with a correlation coefficient (R) of 0.567 and weighted average of 6.1%. Similarly, the statistical analysis conducted on geographies consisting of 60,127,685 people shows a poor positive correlation between the proportion of Tlingit-Haida and unemployment rate among population between the ages 45 and 54 in the United States with a correlation coefficient (R) of 0.111 and weighted average of 4.7%, a difference of 28.3%.
Unemployment Among Ages 45 to 54 years Correlation Summary
| Measurement | Native/Alaskan | Tlingit-Haida |
| Minimum | 0.71% | 1.3% |
| Maximum | 40.0% | 44.4% |
| Range | 39.3% | 43.1% |
| Mean | 10.2% | 10.7% |
| Median | 7.4% | 6.4% |
| Interquartile 25% (IQ1) | 4.8% | 3.4% |
| Interquartile 75% (IQ3) | 13.4% | 12.4% |
| Interquartile Range (IQR) | 8.7% | 9.0% |
| Standard Deviation (Sample) | 7.5% | 11.8% |
| Standard Deviation (Population) | 7.4% | 11.6% |
Similar Demographics by Unemployment Among Ages 45 to 54 years
Demographics Similar to Natives/Alaskans by Unemployment Among Ages 45 to 54 years
In terms of unemployment among ages 45 to 54 years, the demographic groups most similar to Natives/Alaskans are Immigrants from Armenia (6.1%, a difference of 1.3%), Ute (6.2%, a difference of 2.2%), Immigrants from Cabo Verde (5.9%, a difference of 2.3%), Dominican (6.2%, a difference of 2.4%), and Pueblo (6.2%, a difference of 2.6%).
| Demographics | Rating | Rank | Unemployment Among Ages 45 to 54 years |
| Houma | 0.0 /100 | #317 | Tragic 5.6% |
| British West Indians | 0.0 /100 | #318 | Tragic 5.7% |
| Cape Verdeans | 0.0 /100 | #319 | Tragic 5.7% |
| Immigrants | St. Vincent and the Grenadines | 0.0 /100 | #320 | Tragic 5.7% |
| Yakama | 0.0 /100 | #321 | Tragic 5.7% |
| Immigrants | Azores | 0.0 /100 | #322 | Tragic 5.7% |
| Immigrants | Cabo Verde | 0.0 /100 | #323 | Tragic 5.9% |
| Natives/Alaskans | 0.0 /100 | #324 | Tragic 6.1% |
| Immigrants | Armenia | 0.0 /100 | #325 | Tragic 6.1% |
| Ute | 0.0 /100 | #326 | Tragic 6.2% |
| Dominicans | 0.0 /100 | #327 | Tragic 6.2% |
| Pueblo | 0.0 /100 | #328 | Tragic 6.2% |
| Alaska Natives | 0.0 /100 | #329 | Tragic 6.3% |
| Immigrants | Dominican Republic | 0.0 /100 | #330 | Tragic 6.3% |
| Tohono O'odham | 0.0 /100 | #331 | Tragic 6.3% |
Demographics Similar to Tlingit-Haida by Unemployment Among Ages 45 to 54 years
In terms of unemployment among ages 45 to 54 years, the demographic groups most similar to Tlingit-Haida are Cree (4.7%, a difference of 0.010%), Soviet Union (4.7%, a difference of 0.16%), Immigrants (4.7%, a difference of 0.18%), Ottawa (4.7%, a difference of 0.21%), and Immigrants from Ireland (4.7%, a difference of 0.22%).
| Demographics | Rating | Rank | Unemployment Among Ages 45 to 54 years |
| Immigrants | Israel | 3.0 /100 | #229 | Tragic 4.7% |
| Japanese | 2.8 /100 | #230 | Tragic 4.7% |
| Immigrants | Ireland | 2.7 /100 | #231 | Tragic 4.7% |
| Ottawa | 2.7 /100 | #232 | Tragic 4.7% |
| Immigrants | Immigrants | 2.6 /100 | #233 | Tragic 4.7% |
| Soviet Union | 2.6 /100 | #234 | Tragic 4.7% |
| Cree | 2.3 /100 | #235 | Tragic 4.7% |
| Tlingit-Haida | 2.3 /100 | #236 | Tragic 4.7% |
| Alsatians | 1.6 /100 | #237 | Tragic 4.7% |
| Yaqui | 1.4 /100 | #238 | Tragic 4.7% |
| Spanish Americans | 1.4 /100 | #239 | Tragic 4.7% |
| Immigrants | Iraq | 1.3 /100 | #240 | Tragic 4.7% |
| Delaware | 1.3 /100 | #241 | Tragic 4.8% |
| Central Americans | 1.3 /100 | #242 | Tragic 4.8% |
| Portuguese | 1.1 /100 | #243 | Tragic 4.8% |