Native/Alaskan vs German Female Unemployment
COMPARE
Native/Alaskan
German
Female Unemployment
Female Unemployment Comparison
Natives/Alaskans
Germans
6.6%
FEMALE UNEMPLOYMENT
0.0/ 100
METRIC RATING
326th/ 347
METRIC RANK
4.5%
FEMALE UNEMPLOYMENT
100.0/ 100
METRIC RATING
8th/ 347
METRIC RANK
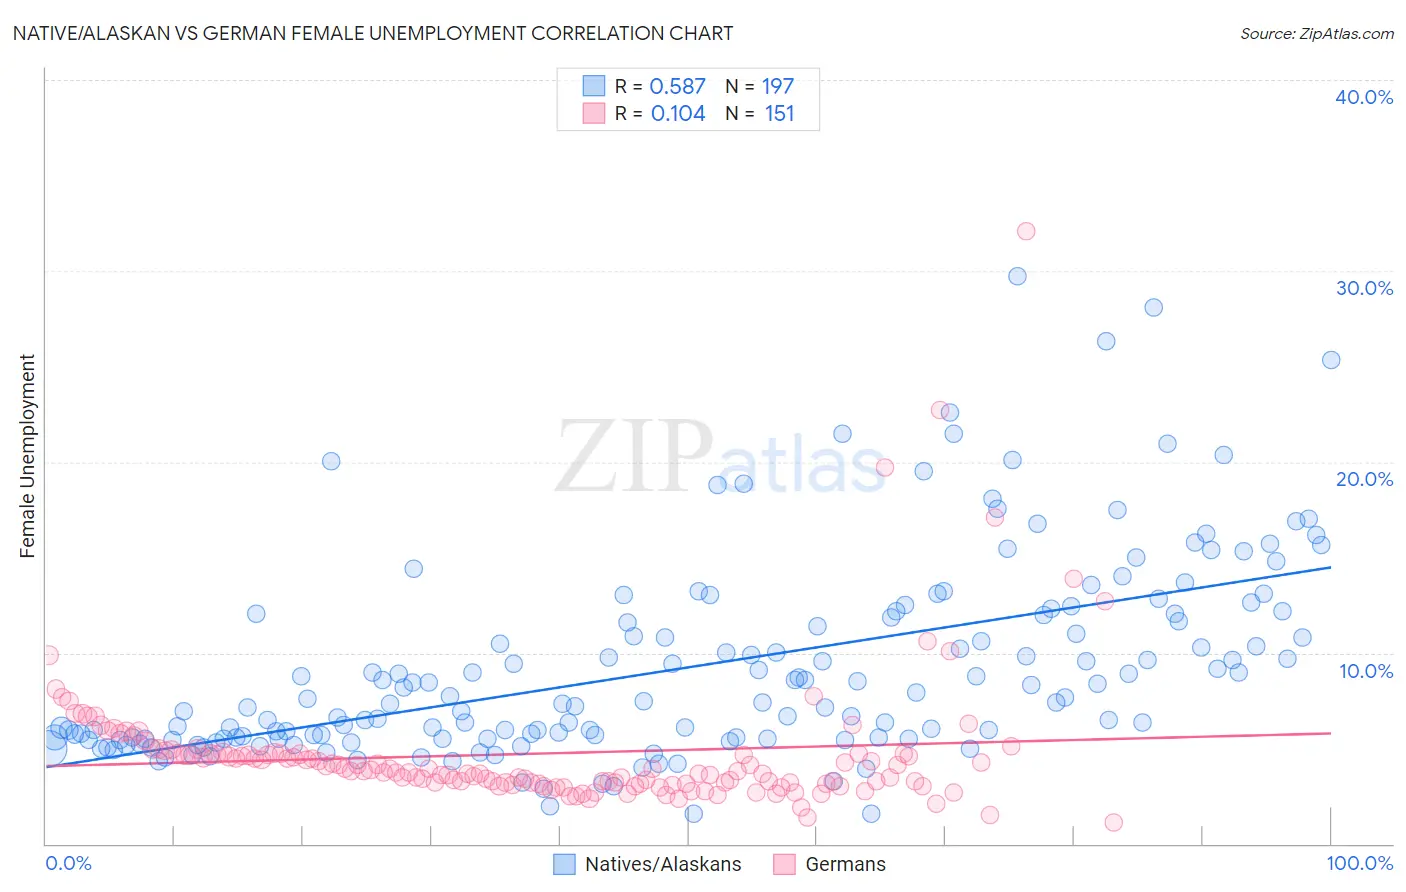
Native/Alaskan vs German Female Unemployment Correlation Chart
The statistical analysis conducted on geographies consisting of 506,227,982 people shows a substantial positive correlation between the proportion of Natives/Alaskans and unemploymnet rate among females in the United States with a correlation coefficient (R) of 0.587 and weighted average of 6.6%. Similarly, the statistical analysis conducted on geographies consisting of 564,194,310 people shows a poor positive correlation between the proportion of Germans and unemploymnet rate among females in the United States with a correlation coefficient (R) of 0.104 and weighted average of 4.5%, a difference of 47.8%.
Female Unemployment Correlation Summary
| Measurement | Native/Alaskan | German |
| Minimum | 1.6% | 1.1% |
| Maximum | 29.7% | 32.1% |
| Range | 28.1% | 31.0% |
| Mean | 9.2% | 4.7% |
| Median | 7.5% | 3.8% |
| Interquartile 25% (IQ1) | 5.5% | 3.2% |
| Interquartile 75% (IQ3) | 12.0% | 4.7% |
| Interquartile Range (IQR) | 6.5% | 1.5% |
| Standard Deviation (Sample) | 5.2% | 3.7% |
| Standard Deviation (Population) | 5.2% | 3.6% |
Similar Demographics by Female Unemployment
Demographics Similar to Natives/Alaskans by Female Unemployment
In terms of female unemployment, the demographic groups most similar to Natives/Alaskans are Alaska Native (6.6%, a difference of 0.090%), Guyanese (6.7%, a difference of 0.52%), Apache (6.6%, a difference of 0.56%), Cheyenne (6.6%, a difference of 0.83%), and Immigrants from Guyana (6.7%, a difference of 0.89%).
| Demographics | Rating | Rank | Female Unemployment |
| Immigrants | Bangladesh | 0.0 /100 | #319 | Tragic 6.5% |
| Immigrants | Dominica | 0.0 /100 | #320 | Tragic 6.5% |
| Blacks/African Americans | 0.0 /100 | #321 | Tragic 6.5% |
| Vietnamese | 0.0 /100 | #322 | Tragic 6.5% |
| Immigrants | Belize | 0.0 /100 | #323 | Tragic 6.5% |
| Cheyenne | 0.0 /100 | #324 | Tragic 6.6% |
| Apache | 0.0 /100 | #325 | Tragic 6.6% |
| Natives/Alaskans | 0.0 /100 | #326 | Tragic 6.6% |
| Alaska Natives | 0.0 /100 | #327 | Tragic 6.6% |
| Guyanese | 0.0 /100 | #328 | Tragic 6.7% |
| Immigrants | Guyana | 0.0 /100 | #329 | Tragic 6.7% |
| Yakama | 0.0 /100 | #330 | Tragic 6.7% |
| Paiute | 0.0 /100 | #331 | Tragic 6.8% |
| Sioux | 0.0 /100 | #332 | Tragic 7.0% |
| Menominee | 0.0 /100 | #333 | Tragic 7.0% |
Demographics Similar to Germans by Female Unemployment
In terms of female unemployment, the demographic groups most similar to Germans are Chinese (4.5%, a difference of 0.020%), Slovene (4.5%, a difference of 0.36%), Swedish (4.4%, a difference of 0.79%), Swiss (4.6%, a difference of 1.7%), and Scandinavian (4.6%, a difference of 1.8%).
| Demographics | Rating | Rank | Female Unemployment |
| Norwegians | 100.0 /100 | #1 | Exceptional 4.2% |
| Czechs | 100.0 /100 | #2 | Exceptional 4.4% |
| Luxembourgers | 100.0 /100 | #3 | Exceptional 4.4% |
| Danes | 100.0 /100 | #4 | Exceptional 4.4% |
| Hmong | 100.0 /100 | #5 | Exceptional 4.4% |
| Swedes | 100.0 /100 | #6 | Exceptional 4.4% |
| Chinese | 100.0 /100 | #7 | Exceptional 4.5% |
| Germans | 100.0 /100 | #8 | Exceptional 4.5% |
| Slovenes | 100.0 /100 | #9 | Exceptional 4.5% |
| Swiss | 100.0 /100 | #10 | Exceptional 4.6% |
| Scandinavians | 100.0 /100 | #11 | Exceptional 4.6% |
| Dutch | 100.0 /100 | #12 | Exceptional 4.6% |
| Belgians | 100.0 /100 | #13 | Exceptional 4.6% |
| Finns | 100.0 /100 | #14 | Exceptional 4.6% |
| English | 100.0 /100 | #15 | Exceptional 4.6% |