Native/Alaskan vs Palestinian Unemployment Among Ages 55 to 59 years
COMPARE
Native/Alaskan
Palestinian
Unemployment Among Ages 55 to 59 years
Unemployment Among Ages 55 to 59 years Comparison
Natives/Alaskans
Palestinians
6.0%
UNEMPLOYMENT AMONG AGES 55 TO 59 YEARS
0.0/ 100
METRIC RATING
326th/ 347
METRIC RANK
4.5%
UNEMPLOYMENT AMONG AGES 55 TO 59 YEARS
99.9/ 100
METRIC RATING
29th/ 347
METRIC RANK
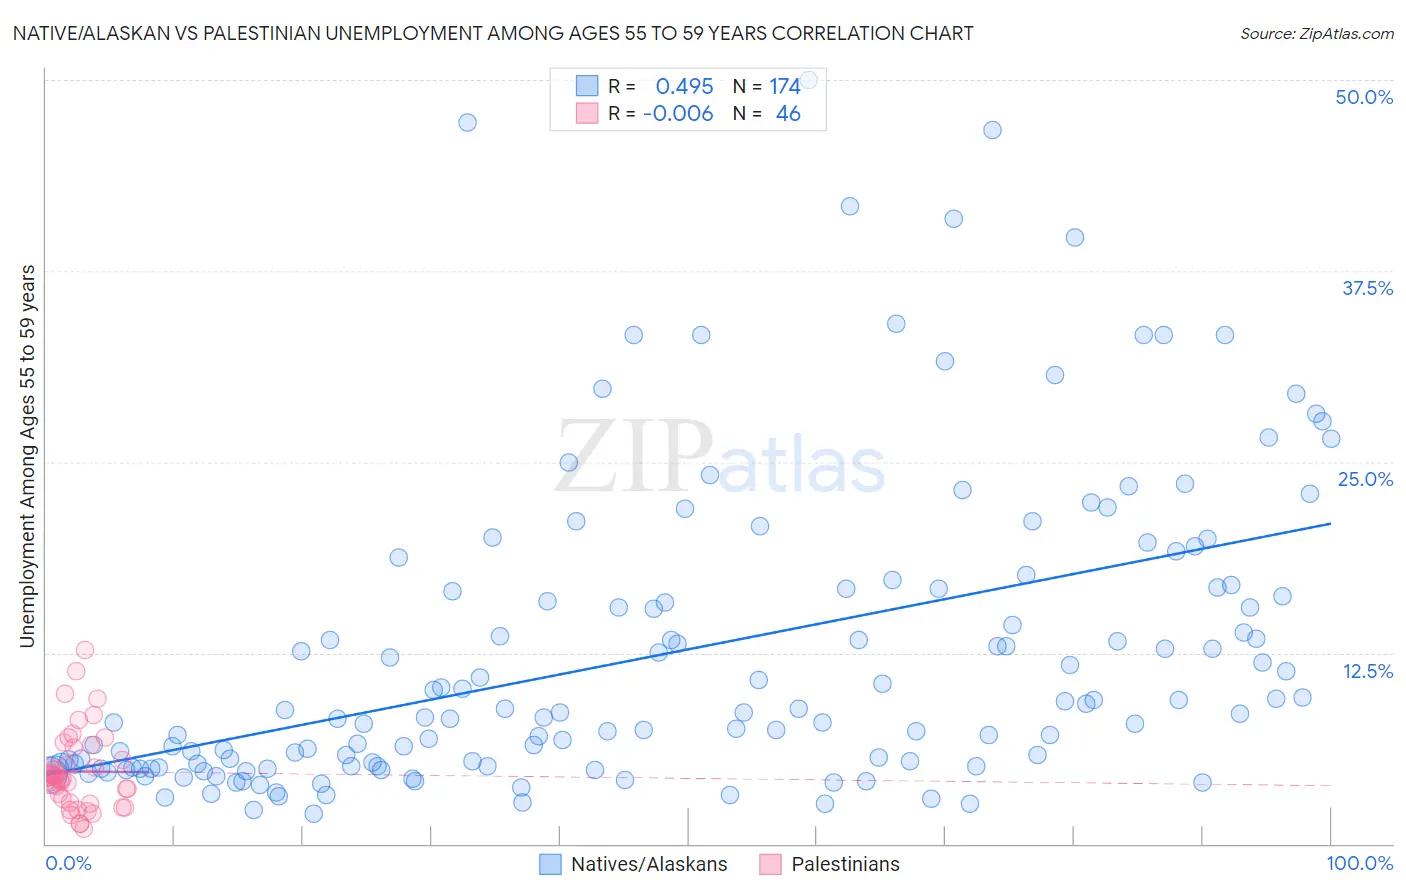
Native/Alaskan vs Palestinian Unemployment Among Ages 55 to 59 years Correlation Chart
The statistical analysis conducted on geographies consisting of 455,461,585 people shows a moderate positive correlation between the proportion of Natives/Alaskans and unemployment rate among population between the ages 55 and 59 in the United States with a correlation coefficient (R) of 0.495 and weighted average of 6.0%. Similarly, the statistical analysis conducted on geographies consisting of 209,432,822 people shows no correlation between the proportion of Palestinians and unemployment rate among population between the ages 55 and 59 in the United States with a correlation coefficient (R) of -0.006 and weighted average of 4.5%, a difference of 34.8%.
Unemployment Among Ages 55 to 59 years Correlation Summary
| Measurement | Native/Alaskan | Palestinian |
| Minimum | 2.0% | 1.0% |
| Maximum | 50.0% | 12.7% |
| Range | 48.0% | 11.7% |
| Mean | 12.5% | 4.7% |
| Median | 8.5% | 4.2% |
| Interquartile 25% (IQ1) | 5.1% | 2.7% |
| Interquartile 75% (IQ3) | 16.7% | 6.3% |
| Interquartile Range (IQR) | 11.6% | 3.6% |
| Standard Deviation (Sample) | 10.1% | 2.6% |
| Standard Deviation (Population) | 10.0% | 2.6% |
Similar Demographics by Unemployment Among Ages 55 to 59 years
Demographics Similar to Natives/Alaskans by Unemployment Among Ages 55 to 59 years
In terms of unemployment among ages 55 to 59 years, the demographic groups most similar to Natives/Alaskans are Immigrants from Armenia (6.0%, a difference of 0.37%), Arapaho (6.1%, a difference of 0.88%), Yuman (6.1%, a difference of 2.1%), Vietnamese (5.9%, a difference of 2.1%), and Crow (5.9%, a difference of 2.2%).
| Demographics | Rating | Rank | Unemployment Among Ages 55 to 59 years |
| Kiowa | 0.0 /100 | #319 | Tragic 5.8% |
| Immigrants | Azores | 0.0 /100 | #320 | Tragic 5.8% |
| Chippewa | 0.0 /100 | #321 | Tragic 5.9% |
| Crow | 0.0 /100 | #322 | Tragic 5.9% |
| Immigrants | Bangladesh | 0.0 /100 | #323 | Tragic 5.9% |
| Vietnamese | 0.0 /100 | #324 | Tragic 5.9% |
| Immigrants | Armenia | 0.0 /100 | #325 | Tragic 6.0% |
| Natives/Alaskans | 0.0 /100 | #326 | Tragic 6.0% |
| Arapaho | 0.0 /100 | #327 | Tragic 6.1% |
| Yuman | 0.0 /100 | #328 | Tragic 6.1% |
| Dominicans | 0.0 /100 | #329 | Tragic 6.2% |
| Alaska Natives | 0.0 /100 | #330 | Tragic 6.2% |
| Immigrants | Dominican Republic | 0.0 /100 | #331 | Tragic 6.3% |
| Aleuts | 0.0 /100 | #332 | Tragic 6.4% |
| Pima | 0.0 /100 | #333 | Tragic 6.6% |
Demographics Similar to Palestinians by Unemployment Among Ages 55 to 59 years
In terms of unemployment among ages 55 to 59 years, the demographic groups most similar to Palestinians are Immigrants from Kenya (4.5%, a difference of 0.020%), Immigrants from Eastern Africa (4.5%, a difference of 0.030%), Immigrants from Zimbabwe (4.5%, a difference of 0.080%), Scandinavian (4.5%, a difference of 0.090%), and German (4.5%, a difference of 0.10%).
| Demographics | Rating | Rank | Unemployment Among Ages 55 to 59 years |
| Immigrants | Burma/Myanmar | 100.0 /100 | #22 | Exceptional 4.4% |
| Kenyans | 100.0 /100 | #23 | Exceptional 4.4% |
| Jordanians | 100.0 /100 | #24 | Exceptional 4.4% |
| Immigrants | Eritrea | 100.0 /100 | #25 | Exceptional 4.4% |
| Scandinavians | 99.9 /100 | #26 | Exceptional 4.5% |
| Immigrants | Zimbabwe | 99.9 /100 | #27 | Exceptional 4.5% |
| Immigrants | Eastern Africa | 99.9 /100 | #28 | Exceptional 4.5% |
| Palestinians | 99.9 /100 | #29 | Exceptional 4.5% |
| Immigrants | Kenya | 99.9 /100 | #30 | Exceptional 4.5% |
| Germans | 99.9 /100 | #31 | Exceptional 4.5% |
| Immigrants | Ethiopia | 99.9 /100 | #32 | Exceptional 4.5% |
| Belgians | 99.9 /100 | #33 | Exceptional 4.5% |
| Thais | 99.9 /100 | #34 | Exceptional 4.5% |
| Cypriots | 99.9 /100 | #35 | Exceptional 4.5% |
| Ethiopians | 99.9 /100 | #36 | Exceptional 4.5% |