Native/Alaskan vs Immigrants from Guatemala Unemployment Among Ages 65 to 74 years
COMPARE
Native/Alaskan
Immigrants from Guatemala
Unemployment Among Ages 65 to 74 years
Unemployment Among Ages 65 to 74 years Comparison
Natives/Alaskans
Immigrants from Guatemala
6.0%
UNEMPLOYMENT AMONG AGES 65 TO 74 YEARS
0.0/ 100
METRIC RATING
326th/ 347
METRIC RANK
5.9%
UNEMPLOYMENT AMONG AGES 65 TO 74 YEARS
0.0/ 100
METRIC RATING
315th/ 347
METRIC RANK
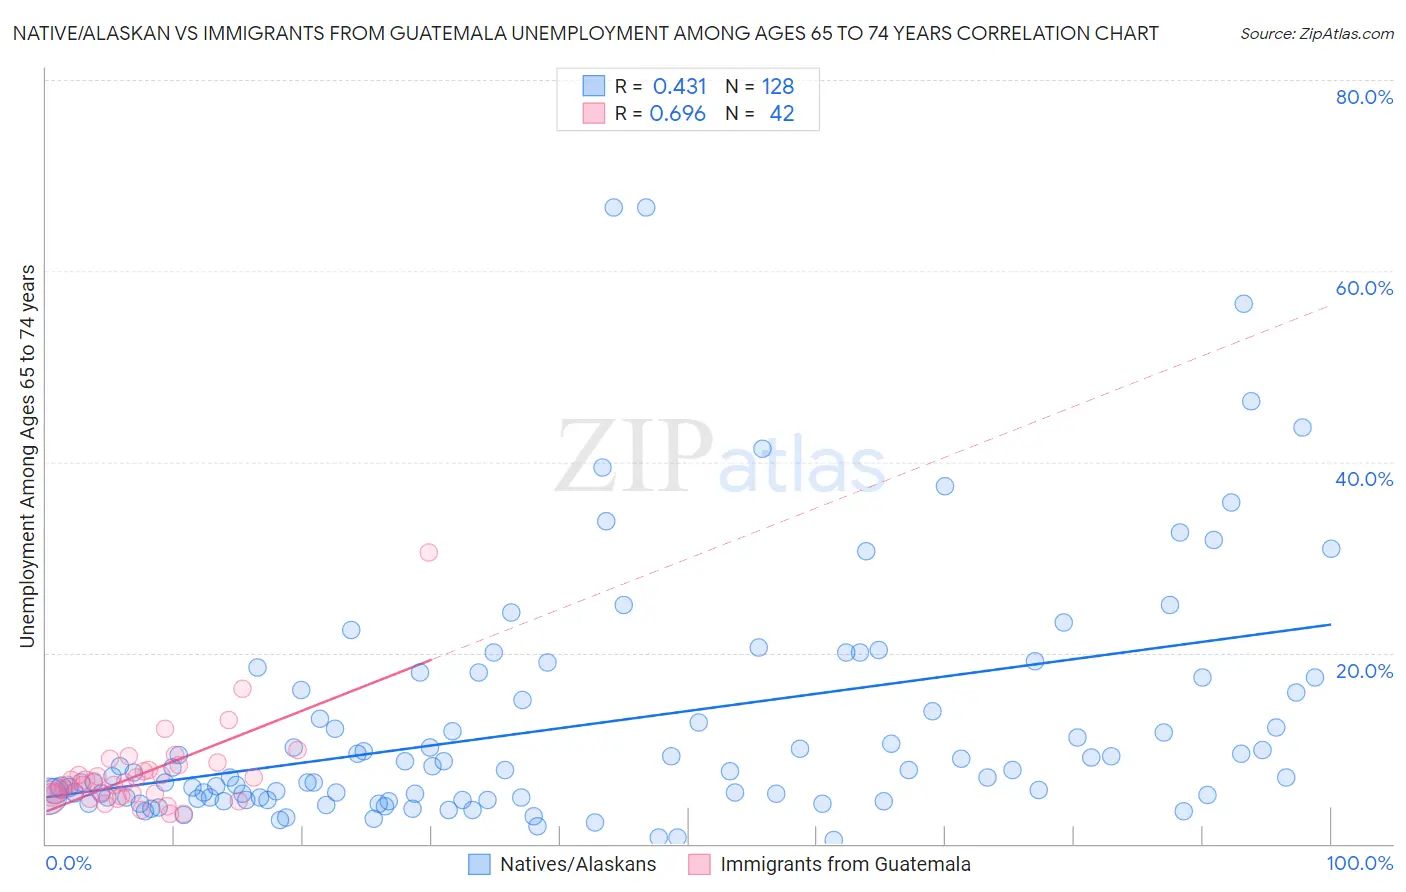
Native/Alaskan vs Immigrants from Guatemala Unemployment Among Ages 65 to 74 years Correlation Chart
The statistical analysis conducted on geographies consisting of 419,713,555 people shows a moderate positive correlation between the proportion of Natives/Alaskans and unemployment rate among population between the ages 65 and 74 in the United States with a correlation coefficient (R) of 0.431 and weighted average of 6.0%. Similarly, the statistical analysis conducted on geographies consisting of 332,866,684 people shows a significant positive correlation between the proportion of Immigrants from Guatemala and unemployment rate among population between the ages 65 and 74 in the United States with a correlation coefficient (R) of 0.696 and weighted average of 5.9%, a difference of 2.8%.
Unemployment Among Ages 65 to 74 years Correlation Summary
| Measurement | Native/Alaskan | Immigrants from Guatemala |
| Minimum | 0.40% | 3.1% |
| Maximum | 66.7% | 30.5% |
| Range | 66.3% | 27.4% |
| Mean | 12.3% | 7.3% |
| Median | 7.6% | 6.3% |
| Interquartile 25% (IQ1) | 4.8% | 5.1% |
| Interquartile 75% (IQ3) | 15.9% | 7.7% |
| Interquartile Range (IQR) | 11.1% | 2.5% |
| Standard Deviation (Sample) | 12.6% | 4.5% |
| Standard Deviation (Population) | 12.6% | 4.4% |
Demographics Similar to Natives/Alaskans and Immigrants from Guatemala by Unemployment Among Ages 65 to 74 years
In terms of unemployment among ages 65 to 74 years, the demographic groups most similar to Natives/Alaskans are Immigrants from Portugal (6.0%, a difference of 0.24%), Tohono O'odham (6.0%, a difference of 0.36%), Delaware (6.0%, a difference of 0.94%), Immigrants from Mexico (6.0%, a difference of 0.99%), and Immigrants from Dominica (6.0%, a difference of 1.2%). Similarly, the demographic groups most similar to Immigrants from Guatemala are Immigrants from Venezuela (5.9%, a difference of 0.010%), Vietnamese (5.9%, a difference of 0.18%), Immigrants from El Salvador (5.9%, a difference of 0.32%), Hispanic or Latino (5.9%, a difference of 0.38%), and Venezuelan (5.9%, a difference of 0.40%).
| Demographics | Rating | Rank | Unemployment Among Ages 65 to 74 years |
| Immigrants | Bangladesh | 0.0 /100 | #310 | Tragic 5.9% |
| Venezuelans | 0.0 /100 | #311 | Tragic 5.9% |
| Hispanics or Latinos | 0.0 /100 | #312 | Tragic 5.9% |
| Vietnamese | 0.0 /100 | #313 | Tragic 5.9% |
| Immigrants | Venezuela | 0.0 /100 | #314 | Tragic 5.9% |
| Immigrants | Guatemala | 0.0 /100 | #315 | Tragic 5.9% |
| Immigrants | El Salvador | 0.0 /100 | #316 | Tragic 5.9% |
| Immigrants | Central America | 0.0 /100 | #317 | Tragic 5.9% |
| Zimbabweans | 0.0 /100 | #318 | Tragic 5.9% |
| Aleuts | 0.0 /100 | #319 | Tragic 5.9% |
| Immigrants | Bahamas | 0.0 /100 | #320 | Tragic 5.9% |
| Immigrants | Dominica | 0.0 /100 | #321 | Tragic 6.0% |
| Immigrants | Mexico | 0.0 /100 | #322 | Tragic 6.0% |
| Delaware | 0.0 /100 | #323 | Tragic 6.0% |
| Tohono O'odham | 0.0 /100 | #324 | Tragic 6.0% |
| Immigrants | Portugal | 0.0 /100 | #325 | Tragic 6.0% |
| Natives/Alaskans | 0.0 /100 | #326 | Tragic 6.0% |
| Shoshone | 0.0 /100 | #327 | Tragic 6.2% |
| Immigrants | Azores | 0.0 /100 | #328 | Tragic 6.2% |
| Yuman | 0.0 /100 | #329 | Tragic 6.2% |
| Dominicans | 0.0 /100 | #330 | Tragic 6.3% |