Nigerian vs Immigrants from Guatemala Unemployment Among Ages 65 to 74 years
COMPARE
Nigerian
Immigrants from Guatemala
Unemployment Among Ages 65 to 74 years
Unemployment Among Ages 65 to 74 years Comparison
Nigerians
Immigrants from Guatemala
5.5%
UNEMPLOYMENT AMONG AGES 65 TO 74 YEARS
2.5/ 100
METRIC RATING
232nd/ 347
METRIC RANK
5.9%
UNEMPLOYMENT AMONG AGES 65 TO 74 YEARS
0.0/ 100
METRIC RATING
315th/ 347
METRIC RANK
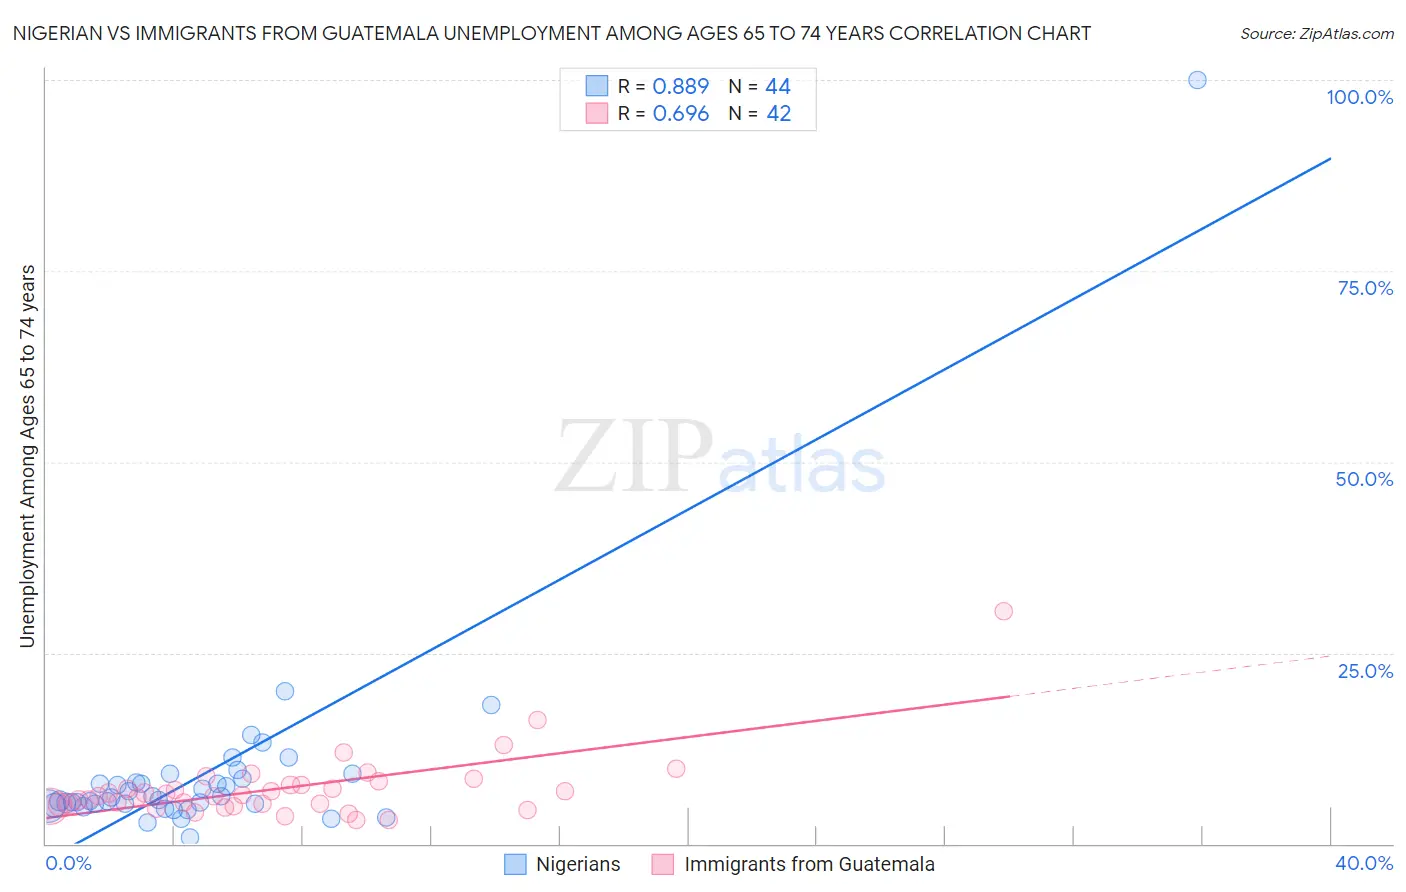
Nigerian vs Immigrants from Guatemala Unemployment Among Ages 65 to 74 years Correlation Chart
The statistical analysis conducted on geographies consisting of 301,316,901 people shows a very strong positive correlation between the proportion of Nigerians and unemployment rate among population between the ages 65 and 74 in the United States with a correlation coefficient (R) of 0.889 and weighted average of 5.5%. Similarly, the statistical analysis conducted on geographies consisting of 332,866,684 people shows a significant positive correlation between the proportion of Immigrants from Guatemala and unemployment rate among population between the ages 65 and 74 in the United States with a correlation coefficient (R) of 0.696 and weighted average of 5.9%, a difference of 6.3%.
Unemployment Among Ages 65 to 74 years Correlation Summary
| Measurement | Nigerian | Immigrants from Guatemala |
| Minimum | 0.77% | 3.1% |
| Maximum | 100.0% | 30.5% |
| Range | 99.2% | 27.4% |
| Mean | 9.2% | 7.3% |
| Median | 5.9% | 6.3% |
| Interquartile 25% (IQ1) | 5.1% | 5.1% |
| Interquartile 75% (IQ3) | 8.2% | 7.7% |
| Interquartile Range (IQR) | 3.1% | 2.5% |
| Standard Deviation (Sample) | 14.5% | 4.5% |
| Standard Deviation (Population) | 14.3% | 4.4% |
Similar Demographics by Unemployment Among Ages 65 to 74 years
Demographics Similar to Nigerians by Unemployment Among Ages 65 to 74 years
In terms of unemployment among ages 65 to 74 years, the demographic groups most similar to Nigerians are Israeli (5.5%, a difference of 0.010%), Immigrants from Caribbean (5.5%, a difference of 0.050%), West Indian (5.5%, a difference of 0.070%), South American Indian (5.5%, a difference of 0.090%), and French American Indian (5.5%, a difference of 0.10%).
| Demographics | Rating | Rank | Unemployment Among Ages 65 to 74 years |
| Immigrants | Trinidad and Tobago | 4.1 /100 | #225 | Tragic 5.5% |
| Hondurans | 3.7 /100 | #226 | Tragic 5.5% |
| Immigrants | Albania | 3.7 /100 | #227 | Tragic 5.5% |
| Immigrants | Israel | 3.0 /100 | #228 | Tragic 5.5% |
| West Indians | 2.7 /100 | #229 | Tragic 5.5% |
| Immigrants | Caribbean | 2.7 /100 | #230 | Tragic 5.5% |
| Israelis | 2.5 /100 | #231 | Tragic 5.5% |
| Nigerians | 2.5 /100 | #232 | Tragic 5.5% |
| South American Indians | 2.3 /100 | #233 | Tragic 5.5% |
| French American Indians | 2.2 /100 | #234 | Tragic 5.5% |
| Peruvians | 2.2 /100 | #235 | Tragic 5.5% |
| Hopi | 2.2 /100 | #236 | Tragic 5.5% |
| Immigrants | Belize | 2.2 /100 | #237 | Tragic 5.5% |
| Cajuns | 1.8 /100 | #238 | Tragic 5.5% |
| German Russians | 1.6 /100 | #239 | Tragic 5.5% |
Demographics Similar to Immigrants from Guatemala by Unemployment Among Ages 65 to 74 years
In terms of unemployment among ages 65 to 74 years, the demographic groups most similar to Immigrants from Guatemala are Immigrants from Venezuela (5.9%, a difference of 0.010%), Vietnamese (5.9%, a difference of 0.18%), Immigrants from El Salvador (5.9%, a difference of 0.32%), Hispanic or Latino (5.9%, a difference of 0.38%), and Venezuelan (5.9%, a difference of 0.40%).
| Demographics | Rating | Rank | Unemployment Among Ages 65 to 74 years |
| Guatemalans | 0.0 /100 | #308 | Tragic 5.8% |
| Immigrants | Ecuador | 0.0 /100 | #309 | Tragic 5.8% |
| Immigrants | Bangladesh | 0.0 /100 | #310 | Tragic 5.9% |
| Venezuelans | 0.0 /100 | #311 | Tragic 5.9% |
| Hispanics or Latinos | 0.0 /100 | #312 | Tragic 5.9% |
| Vietnamese | 0.0 /100 | #313 | Tragic 5.9% |
| Immigrants | Venezuela | 0.0 /100 | #314 | Tragic 5.9% |
| Immigrants | Guatemala | 0.0 /100 | #315 | Tragic 5.9% |
| Immigrants | El Salvador | 0.0 /100 | #316 | Tragic 5.9% |
| Immigrants | Central America | 0.0 /100 | #317 | Tragic 5.9% |
| Zimbabweans | 0.0 /100 | #318 | Tragic 5.9% |
| Aleuts | 0.0 /100 | #319 | Tragic 5.9% |
| Immigrants | Bahamas | 0.0 /100 | #320 | Tragic 5.9% |
| Immigrants | Dominica | 0.0 /100 | #321 | Tragic 6.0% |
| Immigrants | Mexico | 0.0 /100 | #322 | Tragic 6.0% |