Native Hawaiian vs Immigrants from North America Unemployment Among Women with Children Under 18 years
COMPARE
Native Hawaiian
Immigrants from North America
Unemployment Among Women with Children Under 18 years
Unemployment Among Women with Children Under 18 years Comparison
Native Hawaiians
Immigrants from North America
5.3%
UNEMPLOYMENT AMONG WOMEN WITH CHILDREN UNDER 18 YEARS
84.0/ 100
METRIC RATING
124th/ 347
METRIC RANK
5.2%
UNEMPLOYMENT AMONG WOMEN WITH CHILDREN UNDER 18 YEARS
92.3/ 100
METRIC RATING
95th/ 347
METRIC RANK
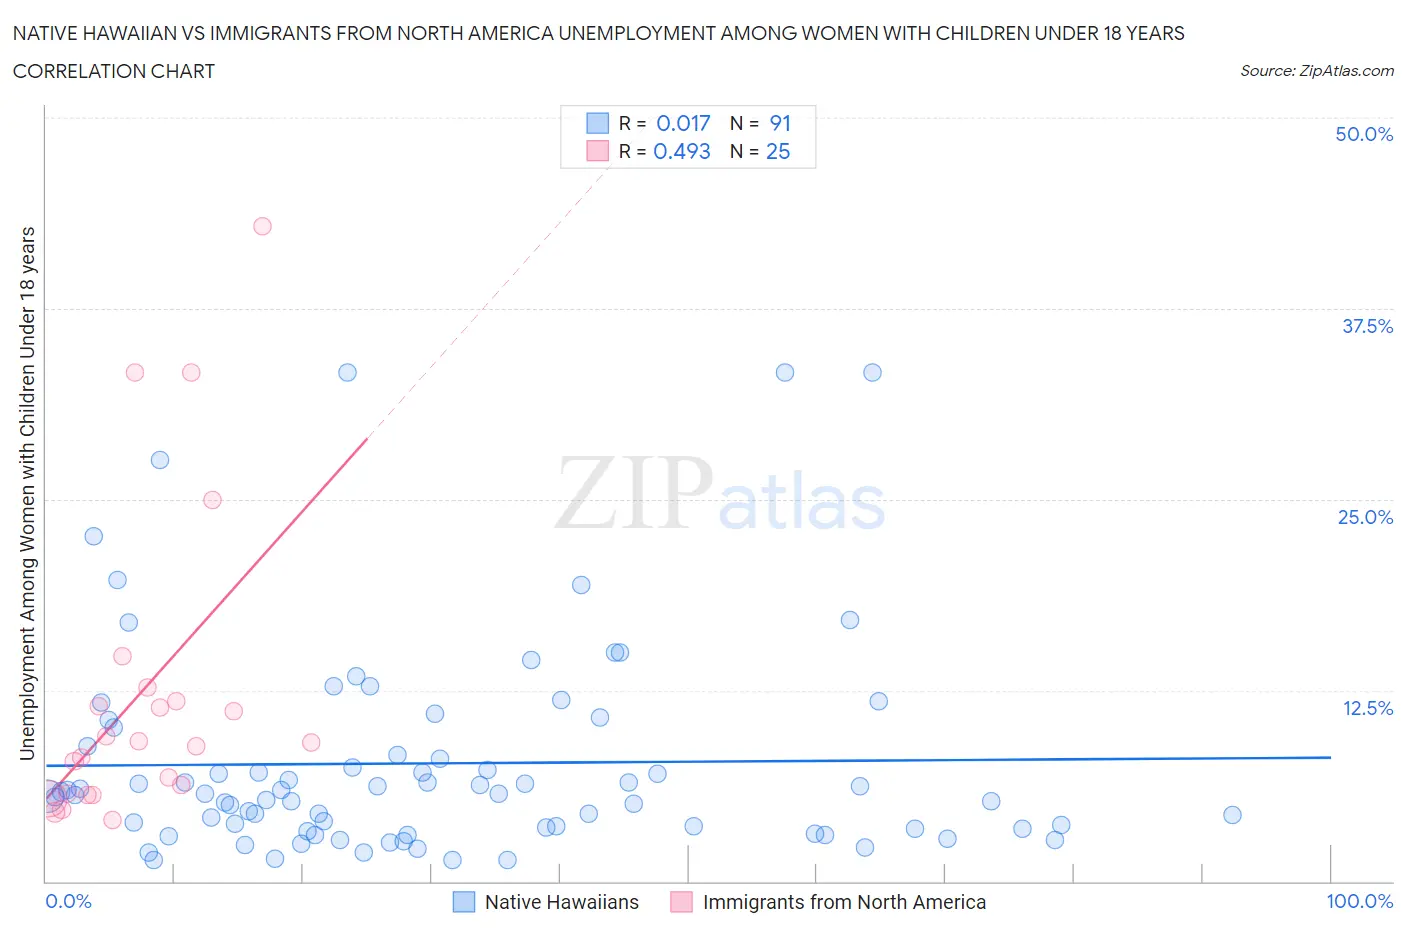
Native Hawaiian vs Immigrants from North America Unemployment Among Women with Children Under 18 years Correlation Chart
The statistical analysis conducted on geographies consisting of 320,560,884 people shows no correlation between the proportion of Native Hawaiians and unemployment rate among women with children under the age of 18 in the United States with a correlation coefficient (R) of 0.017 and weighted average of 5.3%. Similarly, the statistical analysis conducted on geographies consisting of 435,592,906 people shows a moderate positive correlation between the proportion of Immigrants from North America and unemployment rate among women with children under the age of 18 in the United States with a correlation coefficient (R) of 0.493 and weighted average of 5.2%, a difference of 1.5%.
Unemployment Among Women with Children Under 18 years Correlation Summary
| Measurement | Native Hawaiian | Immigrants from North America |
| Minimum | 1.4% | 4.0% |
| Maximum | 33.3% | 42.9% |
| Range | 31.9% | 38.9% |
| Mean | 7.7% | 12.4% |
| Median | 5.7% | 9.1% |
| Interquartile 25% (IQ1) | 3.4% | 5.7% |
| Interquartile 75% (IQ3) | 8.8% | 12.2% |
| Interquartile Range (IQR) | 5.4% | 6.5% |
| Standard Deviation (Sample) | 6.9% | 10.2% |
| Standard Deviation (Population) | 6.8% | 10.0% |
Similar Demographics by Unemployment Among Women with Children Under 18 years
Demographics Similar to Native Hawaiians by Unemployment Among Women with Children Under 18 years
In terms of unemployment among women with children under 18 years, the demographic groups most similar to Native Hawaiians are Sudanese (5.3%, a difference of 0.050%), Immigrants from North Macedonia (5.3%, a difference of 0.11%), Immigrants from Oceania (5.3%, a difference of 0.12%), White/Caucasian (5.3%, a difference of 0.15%), and Immigrants from South Africa (5.3%, a difference of 0.16%).
| Demographics | Rating | Rank | Unemployment Among Women with Children Under 18 years |
| Canadians | 87.4 /100 | #117 | Excellent 5.3% |
| Immigrants | Europe | 86.7 /100 | #118 | Excellent 5.3% |
| Basques | 86.5 /100 | #119 | Excellent 5.3% |
| Egyptians | 86.4 /100 | #120 | Excellent 5.3% |
| Immigrants | Romania | 85.8 /100 | #121 | Excellent 5.3% |
| Scotch-Irish | 85.7 /100 | #122 | Excellent 5.3% |
| Sudanese | 84.3 /100 | #123 | Excellent 5.3% |
| Native Hawaiians | 84.0 /100 | #124 | Excellent 5.3% |
| Immigrants | North Macedonia | 83.2 /100 | #125 | Excellent 5.3% |
| Immigrants | Oceania | 83.1 /100 | #126 | Excellent 5.3% |
| Whites/Caucasians | 82.9 /100 | #127 | Excellent 5.3% |
| Immigrants | South Africa | 82.8 /100 | #128 | Excellent 5.3% |
| Immigrants | Italy | 82.3 /100 | #129 | Excellent 5.3% |
| Immigrants | Austria | 82.1 /100 | #130 | Excellent 5.3% |
| Immigrants | Israel | 81.9 /100 | #131 | Excellent 5.3% |
Demographics Similar to Immigrants from North America by Unemployment Among Women with Children Under 18 years
In terms of unemployment among women with children under 18 years, the demographic groups most similar to Immigrants from North America are Immigrants from Albania (5.2%, a difference of 0.020%), Palestinian (5.2%, a difference of 0.020%), Immigrants from Vietnam (5.2%, a difference of 0.060%), Immigrants from Kuwait (5.2%, a difference of 0.090%), and Cuban (5.2%, a difference of 0.12%).
| Demographics | Rating | Rank | Unemployment Among Women with Children Under 18 years |
| Immigrants | Scotland | 94.5 /100 | #88 | Exceptional 5.2% |
| Immigrants | Turkey | 94.2 /100 | #89 | Exceptional 5.2% |
| Ukrainians | 93.8 /100 | #90 | Exceptional 5.2% |
| Immigrants | Zimbabwe | 93.6 /100 | #91 | Exceptional 5.2% |
| Immigrants | Pakistan | 93.3 /100 | #92 | Exceptional 5.2% |
| Immigrants | Canada | 93.3 /100 | #93 | Exceptional 5.2% |
| Immigrants | Kuwait | 92.6 /100 | #94 | Exceptional 5.2% |
| Immigrants | North America | 92.3 /100 | #95 | Exceptional 5.2% |
| Immigrants | Albania | 92.2 /100 | #96 | Exceptional 5.2% |
| Palestinians | 92.2 /100 | #97 | Exceptional 5.2% |
| Immigrants | Vietnam | 92.0 /100 | #98 | Exceptional 5.2% |
| Cubans | 91.8 /100 | #99 | Exceptional 5.2% |
| Immigrants | Greece | 91.4 /100 | #100 | Exceptional 5.2% |
| Immigrants | Netherlands | 91.0 /100 | #101 | Exceptional 5.2% |
| Immigrants | Cuba | 90.9 /100 | #102 | Exceptional 5.2% |