Arab vs Immigrants from Colombia Unemployment Among Seniors over 75 years
COMPARE
Arab
Immigrants from Colombia
Unemployment Among Seniors over 75 years
Unemployment Among Seniors over 75 years Comparison
Arabs
Immigrants from Colombia
9.5%
UNEMPLOYMENT AMONG SENIORS OVER 75 YEARS
0.2/ 100
METRIC RATING
276th/ 347
METRIC RANK
8.5%
UNEMPLOYMENT AMONG SENIORS OVER 75 YEARS
85.6/ 100
METRIC RATING
148th/ 347
METRIC RANK
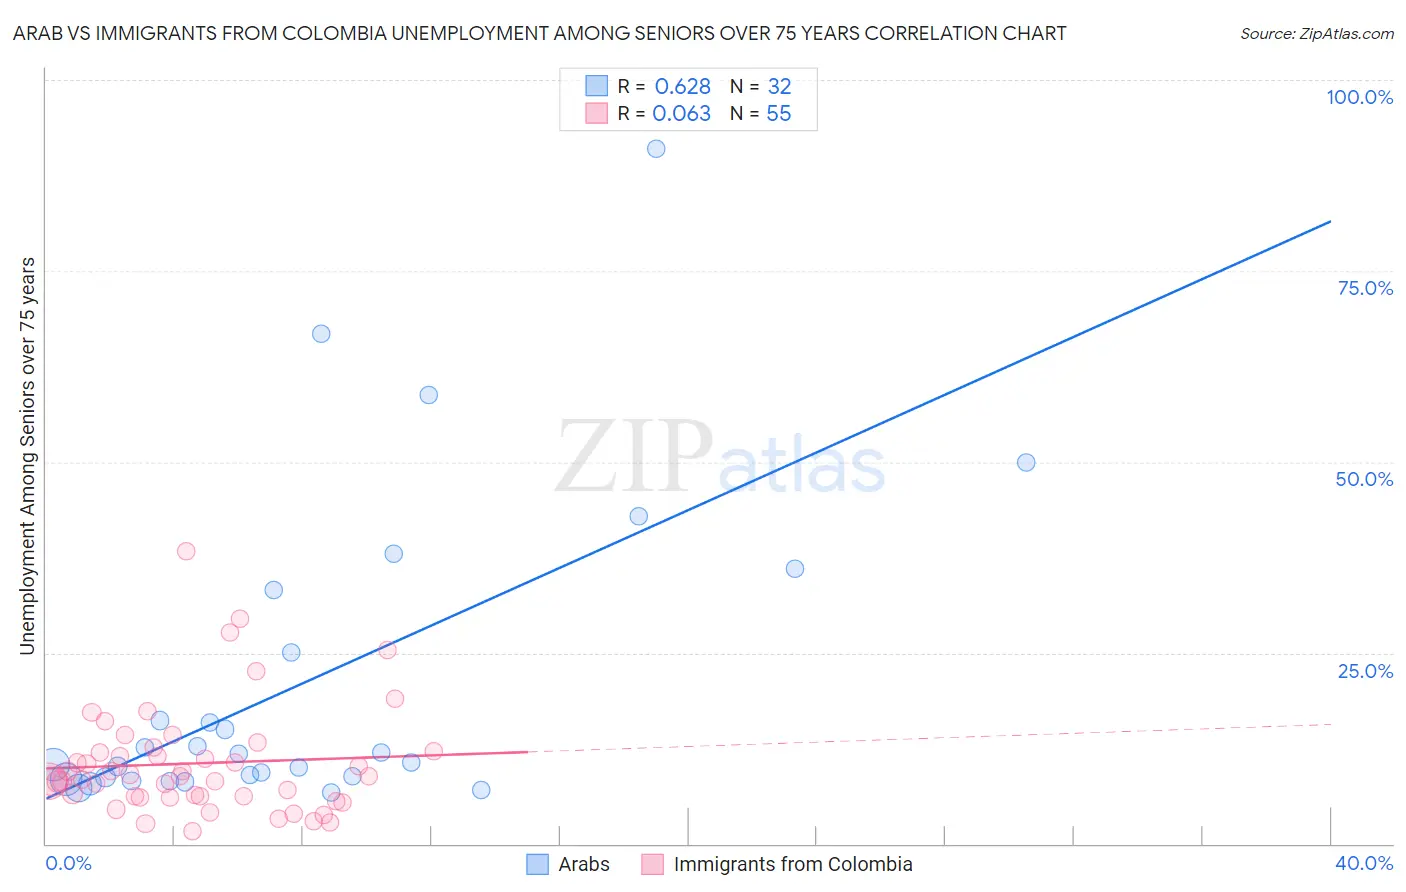
Arab vs Immigrants from Colombia Unemployment Among Seniors over 75 years Correlation Chart
The statistical analysis conducted on geographies consisting of 225,172,972 people shows a significant positive correlation between the proportion of Arabs and unemployment rate among seniors over the age of 75 in the United States with a correlation coefficient (R) of 0.628 and weighted average of 9.5%. Similarly, the statistical analysis conducted on geographies consisting of 196,733,881 people shows a slight positive correlation between the proportion of Immigrants from Colombia and unemployment rate among seniors over the age of 75 in the United States with a correlation coefficient (R) of 0.063 and weighted average of 8.5%, a difference of 11.1%.
Unemployment Among Seniors over 75 years Correlation Summary
| Measurement | Arab | Immigrants from Colombia |
| Minimum | 6.8% | 1.6% |
| Maximum | 91.1% | 38.3% |
| Range | 84.3% | 36.7% |
| Mean | 21.1% | 10.5% |
| Median | 11.2% | 8.8% |
| Interquartile 25% (IQ1) | 8.6% | 6.2% |
| Interquartile 75% (IQ3) | 29.2% | 12.1% |
| Interquartile Range (IQR) | 20.6% | 5.9% |
| Standard Deviation (Sample) | 20.7% | 7.1% |
| Standard Deviation (Population) | 20.4% | 7.1% |
Similar Demographics by Unemployment Among Seniors over 75 years
Demographics Similar to Arabs by Unemployment Among Seniors over 75 years
In terms of unemployment among seniors over 75 years, the demographic groups most similar to Arabs are Senegalese (9.5%, a difference of 0.080%), Jamaican (9.5%, a difference of 0.29%), Czechoslovakian (9.4%, a difference of 0.41%), Swiss (9.5%, a difference of 0.50%), and Immigrants from Iraq (9.4%, a difference of 0.55%).
| Demographics | Rating | Rank | Unemployment Among Seniors over 75 years |
| Puerto Ricans | 0.3 /100 | #269 | Tragic 9.4% |
| Yaqui | 0.3 /100 | #270 | Tragic 9.4% |
| Bulgarians | 0.3 /100 | #271 | Tragic 9.4% |
| Immigrants | Iraq | 0.3 /100 | #272 | Tragic 9.4% |
| Czechoslovakians | 0.3 /100 | #273 | Tragic 9.4% |
| Jamaicans | 0.2 /100 | #274 | Tragic 9.5% |
| Senegalese | 0.2 /100 | #275 | Tragic 9.5% |
| Arabs | 0.2 /100 | #276 | Tragic 9.5% |
| Swiss | 0.1 /100 | #277 | Tragic 9.5% |
| Immigrants | Senegal | 0.1 /100 | #278 | Tragic 9.6% |
| British | 0.1 /100 | #279 | Tragic 9.6% |
| Croatians | 0.1 /100 | #280 | Tragic 9.6% |
| Bangladeshis | 0.1 /100 | #281 | Tragic 9.6% |
| Macedonians | 0.0 /100 | #282 | Tragic 9.6% |
| Immigrants | Nigeria | 0.0 /100 | #283 | Tragic 9.6% |
Demographics Similar to Immigrants from Colombia by Unemployment Among Seniors over 75 years
In terms of unemployment among seniors over 75 years, the demographic groups most similar to Immigrants from Colombia are Immigrants from Sierra Leone (8.5%, a difference of 0.0%), Immigrants from South Eastern Asia (8.5%, a difference of 0.020%), Immigrants from Romania (8.5%, a difference of 0.070%), Immigrants from Ecuador (8.5%, a difference of 0.11%), and Colombian (8.5%, a difference of 0.13%).
| Demographics | Rating | Rank | Unemployment Among Seniors over 75 years |
| Immigrants | Bolivia | 87.9 /100 | #141 | Excellent 8.5% |
| Immigrants | Ukraine | 87.0 /100 | #142 | Excellent 8.5% |
| Immigrants | Costa Rica | 86.8 /100 | #143 | Excellent 8.5% |
| Colombians | 86.7 /100 | #144 | Excellent 8.5% |
| Immigrants | Romania | 86.2 /100 | #145 | Excellent 8.5% |
| Immigrants | South Eastern Asia | 85.8 /100 | #146 | Excellent 8.5% |
| Immigrants | Sierra Leone | 85.6 /100 | #147 | Excellent 8.5% |
| Immigrants | Colombia | 85.6 /100 | #148 | Excellent 8.5% |
| Immigrants | Ecuador | 84.6 /100 | #149 | Excellent 8.5% |
| Paiute | 82.5 /100 | #150 | Excellent 8.6% |
| Immigrants | Bosnia and Herzegovina | 80.6 /100 | #151 | Excellent 8.6% |
| Latvians | 80.5 /100 | #152 | Excellent 8.6% |
| Mongolians | 80.1 /100 | #153 | Excellent 8.6% |
| Immigrants | Pakistan | 79.7 /100 | #154 | Good 8.6% |
| Ecuadorians | 78.5 /100 | #155 | Good 8.6% |