Moroccan vs Brazilian Unemployment Among Women with Children Under 6 years
COMPARE
Moroccan
Brazilian
Unemployment Among Women with Children Under 6 years
Unemployment Among Women with Children Under 6 years Comparison
Moroccans
Brazilians
7.9%
UNEMPLOYMENT AMONG WOMEN WITH CHILDREN UNDER 6 YEARS
9.7/ 100
METRIC RATING
218th/ 347
METRIC RANK
7.7%
UNEMPLOYMENT AMONG WOMEN WITH CHILDREN UNDER 6 YEARS
43.9/ 100
METRIC RATING
181st/ 347
METRIC RANK
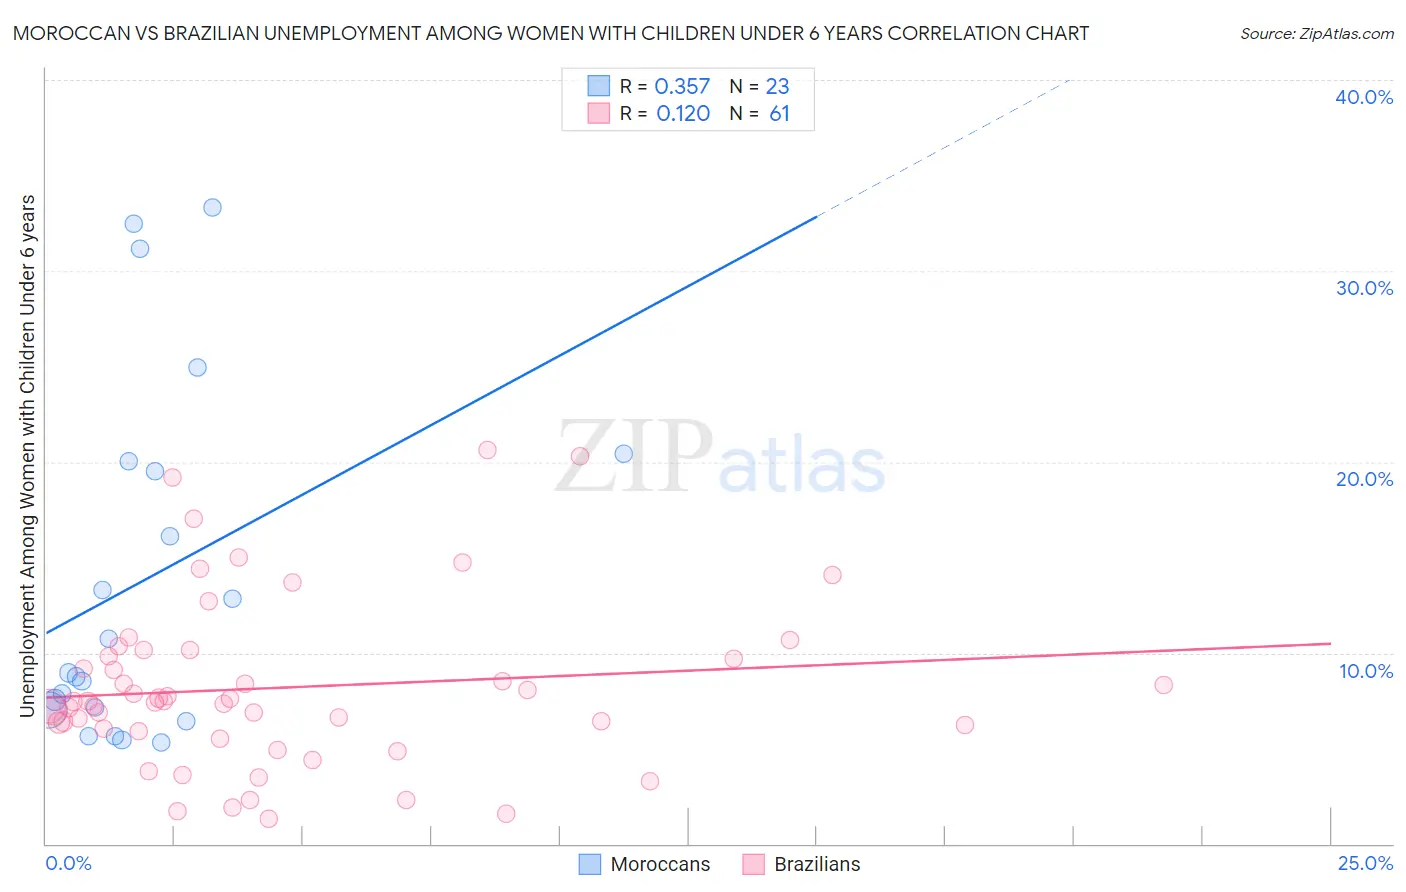
Moroccan vs Brazilian Unemployment Among Women with Children Under 6 years Correlation Chart
The statistical analysis conducted on geographies consisting of 172,421,104 people shows a mild positive correlation between the proportion of Moroccans and unemployment rate among women with children under the age of 6 in the United States with a correlation coefficient (R) of 0.357 and weighted average of 7.9%. Similarly, the statistical analysis conducted on geographies consisting of 256,263,752 people shows a poor positive correlation between the proportion of Brazilians and unemployment rate among women with children under the age of 6 in the United States with a correlation coefficient (R) of 0.120 and weighted average of 7.7%, a difference of 3.3%.
Unemployment Among Women with Children Under 6 years Correlation Summary
| Measurement | Moroccan | Brazilian |
| Minimum | 5.3% | 1.3% |
| Maximum | 33.3% | 20.6% |
| Range | 28.0% | 19.3% |
| Mean | 13.9% | 8.2% |
| Median | 8.9% | 7.5% |
| Interquartile 25% (IQ1) | 7.0% | 6.0% |
| Interquartile 75% (IQ3) | 20.1% | 10.0% |
| Interquartile Range (IQR) | 13.1% | 4.0% |
| Standard Deviation (Sample) | 9.2% | 4.4% |
| Standard Deviation (Population) | 9.0% | 4.4% |
Similar Demographics by Unemployment Among Women with Children Under 6 years
Demographics Similar to Moroccans by Unemployment Among Women with Children Under 6 years
In terms of unemployment among women with children under 6 years, the demographic groups most similar to Moroccans are Arab (7.9%, a difference of 0.070%), South American Indian (7.9%, a difference of 0.090%), Immigrants from Nigeria (7.9%, a difference of 0.11%), Immigrants from Lebanon (7.9%, a difference of 0.23%), and Ecuadorian (7.9%, a difference of 0.24%).
| Demographics | Rating | Rank | Unemployment Among Women with Children Under 6 years |
| Immigrants | Ecuador | 14.9 /100 | #211 | Poor 7.9% |
| Swiss | 12.3 /100 | #212 | Poor 7.9% |
| Scottish | 11.4 /100 | #213 | Poor 7.9% |
| Spanish | 11.3 /100 | #214 | Poor 7.9% |
| Ecuadorians | 11.2 /100 | #215 | Poor 7.9% |
| Immigrants | Lebanon | 11.1 /100 | #216 | Poor 7.9% |
| Immigrants | Nigeria | 10.3 /100 | #217 | Poor 7.9% |
| Moroccans | 9.7 /100 | #218 | Tragic 7.9% |
| Arabs | 9.4 /100 | #219 | Tragic 7.9% |
| South American Indians | 9.3 /100 | #220 | Tragic 7.9% |
| Immigrants | Germany | 8.5 /100 | #221 | Tragic 7.9% |
| Samoans | 8.4 /100 | #222 | Tragic 7.9% |
| Carpatho Rusyns | 7.8 /100 | #223 | Tragic 8.0% |
| English | 7.2 /100 | #224 | Tragic 8.0% |
| Germans | 7.0 /100 | #225 | Tragic 8.0% |
Demographics Similar to Brazilians by Unemployment Among Women with Children Under 6 years
In terms of unemployment among women with children under 6 years, the demographic groups most similar to Brazilians are Nepalese (7.7%, a difference of 0.020%), Immigrants from Uruguay (7.7%, a difference of 0.040%), Immigrants from Western Europe (7.7%, a difference of 0.070%), Sierra Leonean (7.7%, a difference of 0.070%), and Immigrants from England (7.7%, a difference of 0.10%).
| Demographics | Rating | Rank | Unemployment Among Women with Children Under 6 years |
| Immigrants | Laos | 50.0 /100 | #174 | Average 7.6% |
| Panamanians | 49.6 /100 | #175 | Average 7.6% |
| Puget Sound Salish | 47.7 /100 | #176 | Average 7.7% |
| Austrians | 46.0 /100 | #177 | Average 7.7% |
| Immigrants | England | 45.4 /100 | #178 | Average 7.7% |
| Immigrants | Western Europe | 44.9 /100 | #179 | Average 7.7% |
| Immigrants | Uruguay | 44.5 /100 | #180 | Average 7.7% |
| Brazilians | 43.9 /100 | #181 | Average 7.7% |
| Nepalese | 43.5 /100 | #182 | Average 7.7% |
| Sierra Leoneans | 42.9 /100 | #183 | Average 7.7% |
| Indonesians | 40.5 /100 | #184 | Average 7.7% |
| Spanish Americans | 39.7 /100 | #185 | Fair 7.7% |
| Yugoslavians | 39.4 /100 | #186 | Fair 7.7% |
| Immigrants | Thailand | 38.5 /100 | #187 | Fair 7.7% |
| Czechoslovakians | 38.4 /100 | #188 | Fair 7.7% |