Mongolian vs Taiwanese Male Unemployment
COMPARE
Mongolian
Taiwanese
Male Unemployment
Male Unemployment Comparison
Mongolians
Taiwanese
5.1%
MALE UNEMPLOYMENT
88.4/ 100
METRIC RATING
121st/ 347
METRIC RANK
5.3%
MALE UNEMPLOYMENT
37.6/ 100
METRIC RATING
183rd/ 347
METRIC RANK
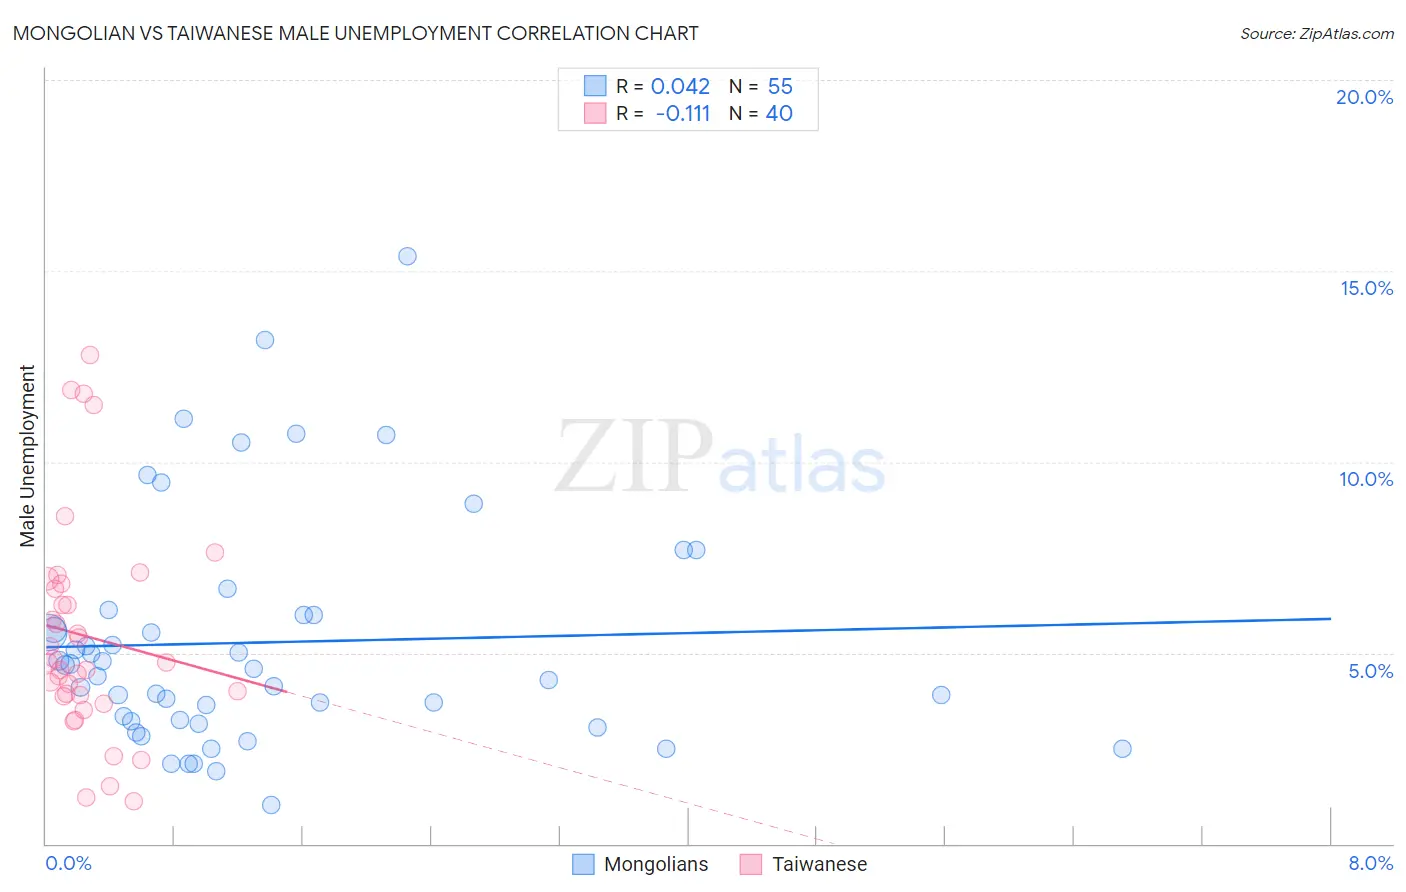
Mongolian vs Taiwanese Male Unemployment Correlation Chart
The statistical analysis conducted on geographies consisting of 140,285,925 people shows no correlation between the proportion of Mongolians and unemployment rate among males in the United States with a correlation coefficient (R) of 0.042 and weighted average of 5.1%. Similarly, the statistical analysis conducted on geographies consisting of 31,713,095 people shows a poor negative correlation between the proportion of Taiwanese and unemployment rate among males in the United States with a correlation coefficient (R) of -0.111 and weighted average of 5.3%, a difference of 3.8%.
Male Unemployment Correlation Summary
| Measurement | Mongolian | Taiwanese |
| Minimum | 1.0% | 1.1% |
| Maximum | 15.4% | 12.8% |
| Range | 14.4% | 11.7% |
| Mean | 5.3% | 5.4% |
| Median | 4.6% | 4.7% |
| Interquartile 25% (IQ1) | 3.2% | 3.9% |
| Interquartile 75% (IQ3) | 6.0% | 6.7% |
| Interquartile Range (IQR) | 2.8% | 2.9% |
| Standard Deviation (Sample) | 3.0% | 2.8% |
| Standard Deviation (Population) | 3.0% | 2.8% |
Similar Demographics by Male Unemployment
Demographics Similar to Mongolians by Male Unemployment
In terms of male unemployment, the demographic groups most similar to Mongolians are Ukrainian (5.1%, a difference of 0.010%), French Canadian (5.1%, a difference of 0.030%), Nicaraguan (5.1%, a difference of 0.030%), Cypriot (5.1%, a difference of 0.070%), and Estonian (5.1%, a difference of 0.10%).
| Demographics | Rating | Rank | Male Unemployment |
| Romanians | 89.8 /100 | #114 | Excellent 5.1% |
| Immigrants | Asia | 89.6 /100 | #115 | Excellent 5.1% |
| Immigrants | Denmark | 89.4 /100 | #116 | Excellent 5.1% |
| Estonians | 89.0 /100 | #117 | Excellent 5.1% |
| Cypriots | 88.8 /100 | #118 | Excellent 5.1% |
| French Canadians | 88.6 /100 | #119 | Excellent 5.1% |
| Ukrainians | 88.4 /100 | #120 | Excellent 5.1% |
| Mongolians | 88.4 /100 | #121 | Excellent 5.1% |
| Nicaraguans | 88.2 /100 | #122 | Excellent 5.1% |
| Palestinians | 87.7 /100 | #123 | Excellent 5.1% |
| Immigrants | Latvia | 87.5 /100 | #124 | Excellent 5.1% |
| Immigrants | Lithuania | 87.2 /100 | #125 | Excellent 5.1% |
| Immigrants | Colombia | 86.8 /100 | #126 | Excellent 5.1% |
| Immigrants | Brazil | 86.3 /100 | #127 | Excellent 5.2% |
| Hungarians | 85.1 /100 | #128 | Excellent 5.2% |
Demographics Similar to Taiwanese by Male Unemployment
In terms of male unemployment, the demographic groups most similar to Taiwanese are Potawatomi (5.3%, a difference of 0.010%), Immigrants from Afghanistan (5.3%, a difference of 0.020%), Malaysian (5.3%, a difference of 0.12%), Spaniard (5.3%, a difference of 0.16%), and Korean (5.3%, a difference of 0.17%).
| Demographics | Rating | Rank | Male Unemployment |
| Immigrants | Poland | 46.0 /100 | #176 | Average 5.3% |
| Immigrants | Peru | 44.6 /100 | #177 | Average 5.3% |
| Osage | 42.5 /100 | #178 | Average 5.3% |
| Immigrants | Oceania | 40.8 /100 | #179 | Average 5.3% |
| Malaysians | 39.6 /100 | #180 | Fair 5.3% |
| Immigrants | Afghanistan | 37.9 /100 | #181 | Fair 5.3% |
| Potawatomi | 37.8 /100 | #182 | Fair 5.3% |
| Taiwanese | 37.6 /100 | #183 | Fair 5.3% |
| Spaniards | 35.1 /100 | #184 | Fair 5.3% |
| Koreans | 34.9 /100 | #185 | Fair 5.3% |
| Iraqis | 31.6 /100 | #186 | Fair 5.4% |
| Costa Ricans | 31.3 /100 | #187 | Fair 5.4% |
| Arabs | 30.2 /100 | #188 | Fair 5.4% |
| Immigrants | South America | 29.4 /100 | #189 | Fair 5.4% |
| Immigrants | Uganda | 28.8 /100 | #190 | Fair 5.4% |