Immigrants from Syria vs Immigrants from South Central Asia Female Unemployment
COMPARE
Immigrants from Syria
Immigrants from South Central Asia
Female Unemployment
Female Unemployment Comparison
Immigrants from Syria
Immigrants from South Central Asia
5.6%
FEMALE UNEMPLOYMENT
0.8/ 100
METRIC RATING
250th/ 347
METRIC RANK
5.0%
FEMALE UNEMPLOYMENT
95.5/ 100
METRIC RATING
96th/ 347
METRIC RANK
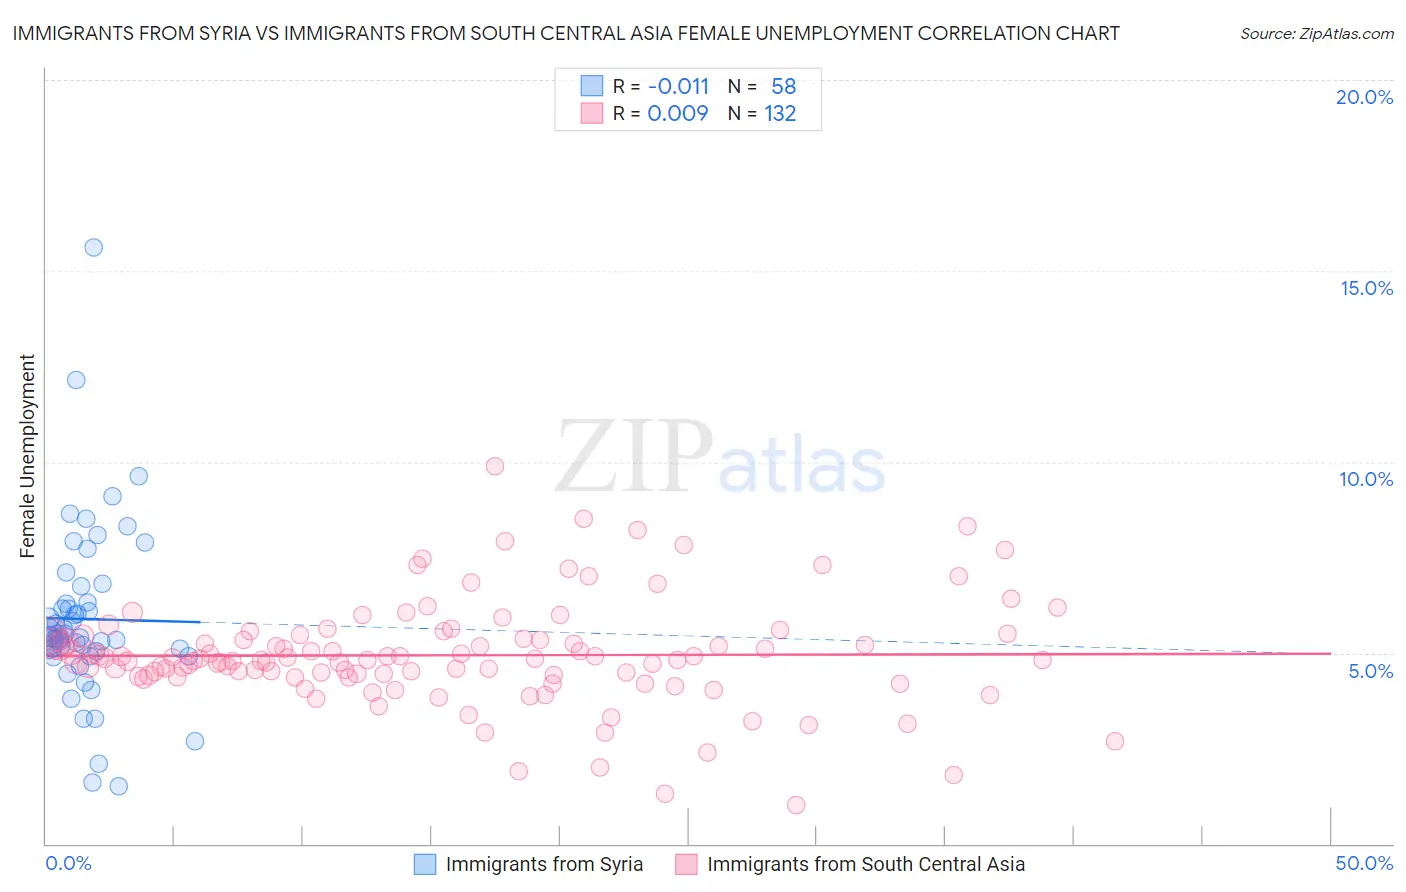
Immigrants from Syria vs Immigrants from South Central Asia Female Unemployment Correlation Chart
The statistical analysis conducted on geographies consisting of 173,953,717 people shows no correlation between the proportion of Immigrants from Syria and unemploymnet rate among females in the United States with a correlation coefficient (R) of -0.011 and weighted average of 5.6%. Similarly, the statistical analysis conducted on geographies consisting of 470,050,410 people shows no correlation between the proportion of Immigrants from South Central Asia and unemploymnet rate among females in the United States with a correlation coefficient (R) of 0.009 and weighted average of 5.0%, a difference of 12.4%.
Female Unemployment Correlation Summary
| Measurement | Immigrants from Syria | Immigrants from South Central Asia |
| Minimum | 1.5% | 1.0% |
| Maximum | 15.6% | 9.9% |
| Range | 14.1% | 8.9% |
| Mean | 5.9% | 4.9% |
| Median | 5.4% | 4.8% |
| Interquartile 25% (IQ1) | 5.0% | 4.4% |
| Interquartile 75% (IQ3) | 6.3% | 5.4% |
| Interquartile Range (IQR) | 1.3% | 1.0% |
| Standard Deviation (Sample) | 2.3% | 1.4% |
| Standard Deviation (Population) | 2.3% | 1.4% |
Similar Demographics by Female Unemployment
Demographics Similar to Immigrants from Syria by Female Unemployment
In terms of female unemployment, the demographic groups most similar to Immigrants from Syria are Assyrian/Chaldean/Syriac (5.6%, a difference of 0.060%), Cajun (5.7%, a difference of 0.26%), Immigrants from Uzbekistan (5.6%, a difference of 0.29%), Cree (5.6%, a difference of 0.33%), and Immigrants from Sierra Leone (5.7%, a difference of 0.41%).
| Demographics | Rating | Rank | Female Unemployment |
| Spanish Americans | 2.2 /100 | #243 | Tragic 5.6% |
| Immigrants | Liberia | 1.5 /100 | #244 | Tragic 5.6% |
| Guamanians/Chamorros | 1.4 /100 | #245 | Tragic 5.6% |
| Japanese | 1.2 /100 | #246 | Tragic 5.6% |
| Immigrants | Western Asia | 1.1 /100 | #247 | Tragic 5.6% |
| Cree | 1.0 /100 | #248 | Tragic 5.6% |
| Immigrants | Uzbekistan | 1.0 /100 | #249 | Tragic 5.6% |
| Immigrants | Syria | 0.8 /100 | #250 | Tragic 5.6% |
| Assyrians/Chaldeans/Syriacs | 0.8 /100 | #251 | Tragic 5.6% |
| Cajuns | 0.7 /100 | #252 | Tragic 5.7% |
| Immigrants | Sierra Leone | 0.6 /100 | #253 | Tragic 5.7% |
| Immigrants | Immigrants | 0.6 /100 | #254 | Tragic 5.7% |
| Immigrants | Cameroon | 0.6 /100 | #255 | Tragic 5.7% |
| Sub-Saharan Africans | 0.4 /100 | #256 | Tragic 5.7% |
| Dutch West Indians | 0.3 /100 | #257 | Tragic 5.7% |
Demographics Similar to Immigrants from South Central Asia by Female Unemployment
In terms of female unemployment, the demographic groups most similar to Immigrants from South Central Asia are Burmese (5.0%, a difference of 0.040%), Immigrants from Malaysia (5.0%, a difference of 0.060%), Immigrants from Austria (5.0%, a difference of 0.090%), Immigrants from Somalia (5.0%, a difference of 0.11%), and Immigrants from Kuwait (5.0%, a difference of 0.11%).
| Demographics | Rating | Rank | Female Unemployment |
| Immigrants | Taiwan | 96.6 /100 | #89 | Exceptional 5.0% |
| Immigrants | Sweden | 96.3 /100 | #90 | Exceptional 5.0% |
| Immigrants | Japan | 96.0 /100 | #91 | Exceptional 5.0% |
| Romanians | 95.9 /100 | #92 | Exceptional 5.0% |
| Immigrants | Austria | 95.7 /100 | #93 | Exceptional 5.0% |
| Immigrants | Malaysia | 95.7 /100 | #94 | Exceptional 5.0% |
| Burmese | 95.6 /100 | #95 | Exceptional 5.0% |
| Immigrants | South Central Asia | 95.5 /100 | #96 | Exceptional 5.0% |
| Immigrants | Somalia | 95.2 /100 | #97 | Exceptional 5.0% |
| Immigrants | Kuwait | 95.2 /100 | #98 | Exceptional 5.0% |
| Immigrants | Zaire | 95.2 /100 | #99 | Exceptional 5.0% |
| Indonesians | 95.1 /100 | #100 | Exceptional 5.0% |
| Immigrants | Czechoslovakia | 95.0 /100 | #101 | Exceptional 5.0% |
| Immigrants | Kenya | 94.8 /100 | #102 | Exceptional 5.0% |
| Somalis | 94.6 /100 | #103 | Exceptional 5.0% |