Hopi vs Immigrants from South Central Asia Female Unemployment
COMPARE
Hopi
Immigrants from South Central Asia
Female Unemployment
Female Unemployment Comparison
Hopi
Immigrants from South Central Asia
8.1%
FEMALE UNEMPLOYMENT
0.0/ 100
METRIC RATING
340th/ 347
METRIC RANK
5.0%
FEMALE UNEMPLOYMENT
95.5/ 100
METRIC RATING
96th/ 347
METRIC RANK
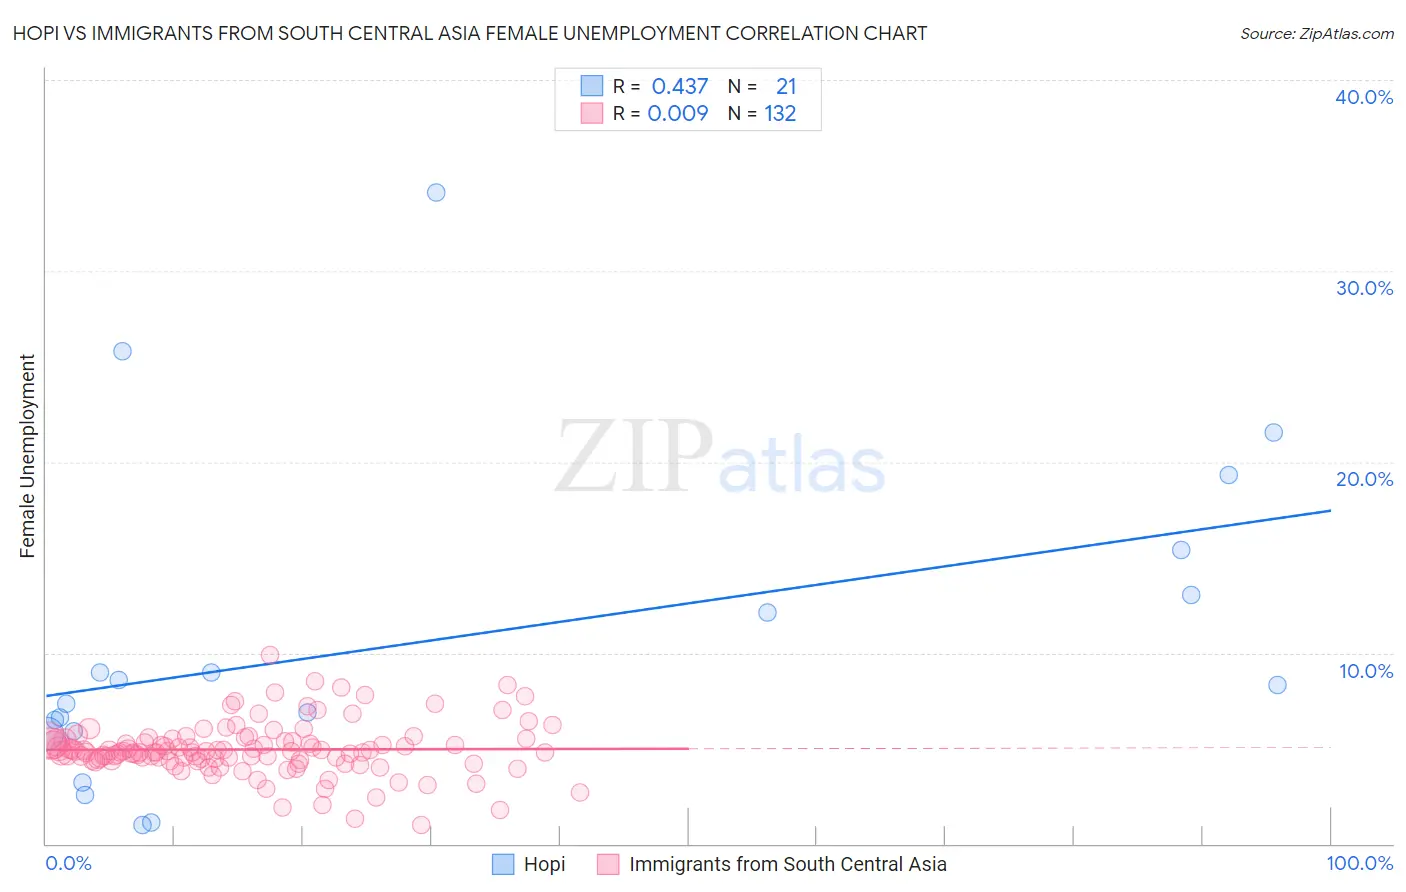
Hopi vs Immigrants from South Central Asia Female Unemployment Correlation Chart
The statistical analysis conducted on geographies consisting of 74,668,306 people shows a moderate positive correlation between the proportion of Hopi and unemploymnet rate among females in the United States with a correlation coefficient (R) of 0.437 and weighted average of 8.1%. Similarly, the statistical analysis conducted on geographies consisting of 470,050,410 people shows no correlation between the proportion of Immigrants from South Central Asia and unemploymnet rate among females in the United States with a correlation coefficient (R) of 0.009 and weighted average of 5.0%, a difference of 61.4%.
Female Unemployment Correlation Summary
| Measurement | Hopi | Immigrants from South Central Asia |
| Minimum | 1.0% | 1.0% |
| Maximum | 34.1% | 9.9% |
| Range | 33.1% | 8.9% |
| Mean | 10.6% | 4.9% |
| Median | 8.3% | 4.8% |
| Interquartile 25% (IQ1) | 5.8% | 4.4% |
| Interquartile 75% (IQ3) | 14.2% | 5.4% |
| Interquartile Range (IQR) | 8.4% | 1.0% |
| Standard Deviation (Sample) | 8.5% | 1.4% |
| Standard Deviation (Population) | 8.2% | 1.4% |
Similar Demographics by Female Unemployment
Demographics Similar to Hopi by Female Unemployment
In terms of female unemployment, the demographic groups most similar to Hopi are Inupiat (8.2%, a difference of 0.76%), Puerto Rican (8.3%, a difference of 3.0%), Immigrants from Yemen (7.8%, a difference of 3.3%), Tohono O'odham (7.7%, a difference of 4.5%), and Arapaho (8.8%, a difference of 8.6%).
| Demographics | Rating | Rank | Female Unemployment |
| Menominee | 0.0 /100 | #333 | Tragic 7.0% |
| Immigrants | Armenia | 0.0 /100 | #334 | Tragic 7.1% |
| Dominicans | 0.0 /100 | #335 | Tragic 7.2% |
| Immigrants | Dominican Republic | 0.0 /100 | #336 | Tragic 7.2% |
| Navajo | 0.0 /100 | #337 | Tragic 7.3% |
| Tohono O'odham | 0.0 /100 | #338 | Tragic 7.7% |
| Immigrants | Yemen | 0.0 /100 | #339 | Tragic 7.8% |
| Hopi | 0.0 /100 | #340 | Tragic 8.1% |
| Inupiat | 0.0 /100 | #341 | Tragic 8.2% |
| Puerto Ricans | 0.0 /100 | #342 | Tragic 8.3% |
| Arapaho | 0.0 /100 | #343 | Tragic 8.8% |
| Pima | 0.0 /100 | #344 | Tragic 9.3% |
| Yuman | 0.0 /100 | #345 | Tragic 9.6% |
| Yup'ik | 0.0 /100 | #346 | Tragic 10.9% |
| Crow | 0.0 /100 | #347 | Tragic 12.1% |
Demographics Similar to Immigrants from South Central Asia by Female Unemployment
In terms of female unemployment, the demographic groups most similar to Immigrants from South Central Asia are Burmese (5.0%, a difference of 0.040%), Immigrants from Malaysia (5.0%, a difference of 0.060%), Immigrants from Austria (5.0%, a difference of 0.090%), Immigrants from Somalia (5.0%, a difference of 0.11%), and Immigrants from Kuwait (5.0%, a difference of 0.11%).
| Demographics | Rating | Rank | Female Unemployment |
| Immigrants | Taiwan | 96.6 /100 | #89 | Exceptional 5.0% |
| Immigrants | Sweden | 96.3 /100 | #90 | Exceptional 5.0% |
| Immigrants | Japan | 96.0 /100 | #91 | Exceptional 5.0% |
| Romanians | 95.9 /100 | #92 | Exceptional 5.0% |
| Immigrants | Austria | 95.7 /100 | #93 | Exceptional 5.0% |
| Immigrants | Malaysia | 95.7 /100 | #94 | Exceptional 5.0% |
| Burmese | 95.6 /100 | #95 | Exceptional 5.0% |
| Immigrants | South Central Asia | 95.5 /100 | #96 | Exceptional 5.0% |
| Immigrants | Somalia | 95.2 /100 | #97 | Exceptional 5.0% |
| Immigrants | Kuwait | 95.2 /100 | #98 | Exceptional 5.0% |
| Immigrants | Zaire | 95.2 /100 | #99 | Exceptional 5.0% |
| Indonesians | 95.1 /100 | #100 | Exceptional 5.0% |
| Immigrants | Czechoslovakia | 95.0 /100 | #101 | Exceptional 5.0% |
| Immigrants | Kenya | 94.8 /100 | #102 | Exceptional 5.0% |
| Somalis | 94.6 /100 | #103 | Exceptional 5.0% |