Mongolian vs Immigrants from England Unemployment Among Ages 30 to 34 years
COMPARE
Mongolian
Immigrants from England
Unemployment Among Ages 30 to 34 years
Unemployment Among Ages 30 to 34 years Comparison
Mongolians
Immigrants from England
5.2%
UNEMPLOYMENT AMONG AGES 30 TO 34 YEARS
91.7/ 100
METRIC RATING
96th/ 347
METRIC RANK
5.5%
UNEMPLOYMENT AMONG AGES 30 TO 34 YEARS
35.7/ 100
METRIC RATING
189th/ 347
METRIC RANK
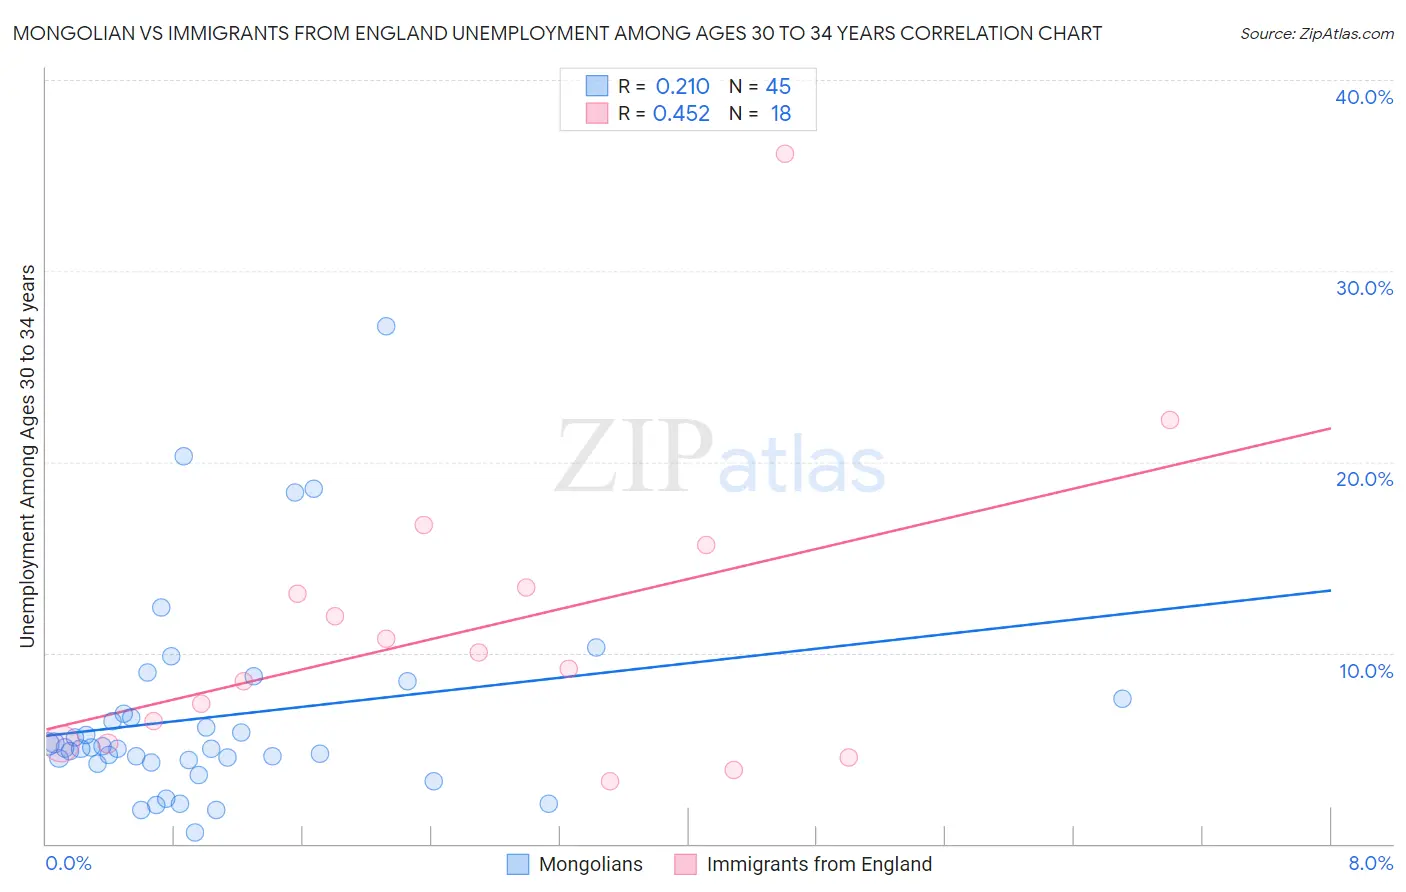
Mongolian vs Immigrants from England Unemployment Among Ages 30 to 34 years Correlation Chart
The statistical analysis conducted on geographies consisting of 137,790,931 people shows a weak positive correlation between the proportion of Mongolians and unemployment rate among population between the ages 30 and 34 in the United States with a correlation coefficient (R) of 0.210 and weighted average of 5.2%. Similarly, the statistical analysis conducted on geographies consisting of 366,760,439 people shows a moderate positive correlation between the proportion of Immigrants from England and unemployment rate among population between the ages 30 and 34 in the United States with a correlation coefficient (R) of 0.452 and weighted average of 5.5%, a difference of 5.4%.
Unemployment Among Ages 30 to 34 years Correlation Summary
| Measurement | Mongolian | Immigrants from England |
| Minimum | 0.60% | 3.3% |
| Maximum | 27.1% | 36.1% |
| Range | 26.5% | 32.8% |
| Mean | 6.7% | 11.3% |
| Median | 5.0% | 9.6% |
| Interquartile 25% (IQ1) | 4.3% | 5.3% |
| Interquartile 75% (IQ3) | 7.2% | 13.4% |
| Interquartile Range (IQR) | 2.9% | 8.2% |
| Standard Deviation (Sample) | 5.2% | 8.0% |
| Standard Deviation (Population) | 5.2% | 7.8% |
Similar Demographics by Unemployment Among Ages 30 to 34 years
Demographics Similar to Mongolians by Unemployment Among Ages 30 to 34 years
In terms of unemployment among ages 30 to 34 years, the demographic groups most similar to Mongolians are European (5.2%, a difference of 0.010%), Kenyan (5.2%, a difference of 0.090%), Maltese (5.2%, a difference of 0.16%), Laotian (5.2%, a difference of 0.17%), and Immigrants from North Macedonia (5.2%, a difference of 0.19%).
| Demographics | Rating | Rank | Unemployment Among Ages 30 to 34 years |
| Immigrants | Sweden | 93.3 /100 | #89 | Exceptional 5.2% |
| Immigrants | Romania | 92.8 /100 | #90 | Exceptional 5.2% |
| Iraqis | 92.6 /100 | #91 | Exceptional 5.2% |
| Immigrants | Argentina | 92.5 /100 | #92 | Exceptional 5.2% |
| Laotians | 92.4 /100 | #93 | Exceptional 5.2% |
| Maltese | 92.3 /100 | #94 | Exceptional 5.2% |
| Kenyans | 92.1 /100 | #95 | Exceptional 5.2% |
| Mongolians | 91.7 /100 | #96 | Exceptional 5.2% |
| Europeans | 91.7 /100 | #97 | Exceptional 5.2% |
| Immigrants | North Macedonia | 90.9 /100 | #98 | Exceptional 5.2% |
| Immigrants | Ireland | 90.6 /100 | #99 | Exceptional 5.2% |
| Immigrants | Czechoslovakia | 89.5 /100 | #100 | Excellent 5.3% |
| British | 89.1 /100 | #101 | Excellent 5.3% |
| Immigrants | Switzerland | 88.8 /100 | #102 | Excellent 5.3% |
| Immigrants | Jordan | 88.8 /100 | #103 | Excellent 5.3% |
Demographics Similar to Immigrants from England by Unemployment Among Ages 30 to 34 years
In terms of unemployment among ages 30 to 34 years, the demographic groups most similar to Immigrants from England are Immigrants from Norway (5.5%, a difference of 0.030%), Immigrants from Kazakhstan (5.5%, a difference of 0.14%), Canadian (5.5%, a difference of 0.19%), Immigrants from Western Asia (5.5%, a difference of 0.19%), and Immigrants from Western Europe (5.5%, a difference of 0.25%).
| Demographics | Rating | Rank | Unemployment Among Ages 30 to 34 years |
| Immigrants | Denmark | 43.4 /100 | #182 | Average 5.5% |
| Hungarians | 43.1 /100 | #183 | Average 5.5% |
| Malaysians | 41.8 /100 | #184 | Average 5.5% |
| Immigrants | Western Europe | 39.1 /100 | #185 | Fair 5.5% |
| Canadians | 38.2 /100 | #186 | Fair 5.5% |
| Immigrants | Western Asia | 38.2 /100 | #187 | Fair 5.5% |
| Immigrants | Norway | 36.1 /100 | #188 | Fair 5.5% |
| Immigrants | England | 35.7 /100 | #189 | Fair 5.5% |
| Immigrants | Kazakhstan | 33.9 /100 | #190 | Fair 5.5% |
| Irish | 31.3 /100 | #191 | Fair 5.5% |
| Moroccans | 31.2 /100 | #192 | Fair 5.5% |
| Immigrants | Africa | 31.0 /100 | #193 | Fair 5.5% |
| Slavs | 30.9 /100 | #194 | Fair 5.5% |
| Finns | 30.7 /100 | #195 | Fair 5.5% |
| Immigrants | South America | 29.8 /100 | #196 | Fair 5.5% |