Luxembourger vs Okinawan Unemployment Among Ages 35 to 44 years
COMPARE
Luxembourger
Okinawan
Unemployment Among Ages 35 to 44 years
Unemployment Among Ages 35 to 44 years Comparison
Luxembourgers
Okinawans
4.3%
UNEMPLOYMENT AMONG AGES 35 TO 44 YEARS
99.0/ 100
METRIC RATING
35th/ 347
METRIC RANK
4.4%
UNEMPLOYMENT AMONG AGES 35 TO 44 YEARS
97.7/ 100
METRIC RATING
52nd/ 347
METRIC RANK
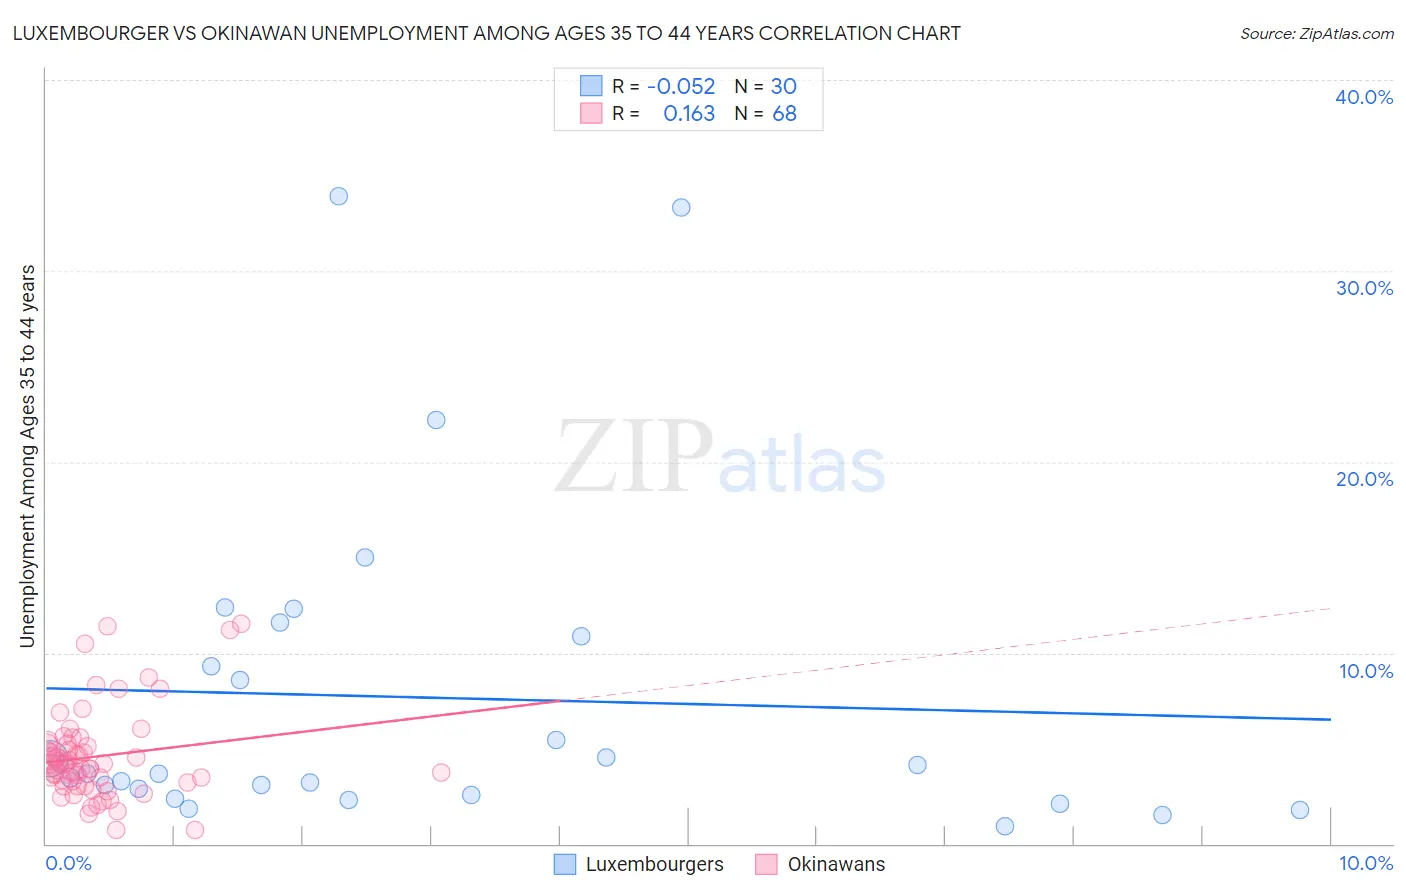
Luxembourger vs Okinawan Unemployment Among Ages 35 to 44 years Correlation Chart
The statistical analysis conducted on geographies consisting of 142,430,740 people shows a slight negative correlation between the proportion of Luxembourgers and unemployment rate among population between the ages 35 and 44 in the United States with a correlation coefficient (R) of -0.052 and weighted average of 4.3%. Similarly, the statistical analysis conducted on geographies consisting of 73,536,762 people shows a poor positive correlation between the proportion of Okinawans and unemployment rate among population between the ages 35 and 44 in the United States with a correlation coefficient (R) of 0.163 and weighted average of 4.4%, a difference of 1.5%.
Unemployment Among Ages 35 to 44 years Correlation Summary
| Measurement | Luxembourger | Okinawan |
| Minimum | 0.90% | 0.70% |
| Maximum | 33.9% | 11.5% |
| Range | 33.0% | 10.8% |
| Mean | 7.7% | 4.6% |
| Median | 3.7% | 4.2% |
| Interquartile 25% (IQ1) | 2.6% | 3.3% |
| Interquartile 75% (IQ3) | 10.9% | 5.2% |
| Interquartile Range (IQR) | 8.3% | 2.0% |
| Standard Deviation (Sample) | 8.6% | 2.3% |
| Standard Deviation (Population) | 8.4% | 2.3% |
Demographics Similar to Luxembourgers and Okinawans by Unemployment Among Ages 35 to 44 years
In terms of unemployment among ages 35 to 44 years, the demographic groups most similar to Luxembourgers are Jordanian (4.3%, a difference of 0.030%), Mongolian (4.3%, a difference of 0.10%), Immigrants from Zimbabwe (4.3%, a difference of 0.15%), Immigrants from Sri Lanka (4.3%, a difference of 0.18%), and Burmese (4.3%, a difference of 0.22%). Similarly, the demographic groups most similar to Okinawans are Immigrants from Eastern Asia (4.4%, a difference of 0.020%), Immigrants from Turkey (4.4%, a difference of 0.040%), Immigrants from Argentina (4.4%, a difference of 0.14%), Swiss (4.4%, a difference of 0.44%), and Bhutanese (4.4%, a difference of 0.45%).
| Demographics | Rating | Rank | Unemployment Among Ages 35 to 44 years |
| Immigrants | Sri Lanka | 99.1 /100 | #33 | Exceptional 4.3% |
| Jordanians | 99.0 /100 | #34 | Exceptional 4.3% |
| Luxembourgers | 99.0 /100 | #35 | Exceptional 4.3% |
| Mongolians | 98.9 /100 | #36 | Exceptional 4.3% |
| Immigrants | Zimbabwe | 98.9 /100 | #37 | Exceptional 4.3% |
| Burmese | 98.9 /100 | #38 | Exceptional 4.3% |
| Palestinians | 98.8 /100 | #39 | Exceptional 4.3% |
| Zimbabweans | 98.8 /100 | #40 | Exceptional 4.3% |
| Belgians | 98.7 /100 | #41 | Exceptional 4.3% |
| Germans | 98.7 /100 | #42 | Exceptional 4.3% |
| Eastern Europeans | 98.7 /100 | #43 | Exceptional 4.3% |
| Immigrants | Malaysia | 98.7 /100 | #44 | Exceptional 4.3% |
| Immigrants | Korea | 98.4 /100 | #45 | Exceptional 4.3% |
| Immigrants | Belgium | 98.4 /100 | #46 | Exceptional 4.3% |
| British | 98.3 /100 | #47 | Exceptional 4.4% |
| Bhutanese | 98.2 /100 | #48 | Exceptional 4.4% |
| Swiss | 98.2 /100 | #49 | Exceptional 4.4% |
| Immigrants | Turkey | 97.8 /100 | #50 | Exceptional 4.4% |
| Immigrants | Eastern Asia | 97.8 /100 | #51 | Exceptional 4.4% |
| Okinawans | 97.7 /100 | #52 | Exceptional 4.4% |
| Immigrants | Argentina | 97.6 /100 | #53 | Exceptional 4.4% |