Immigrants from Guyana vs Immigrants from Trinidad and Tobago Unemployment Among Ages 20 to 24 years
COMPARE
Immigrants from Guyana
Immigrants from Trinidad and Tobago
Unemployment Among Ages 20 to 24 years
Unemployment Among Ages 20 to 24 years Comparison
Immigrants from Guyana
Immigrants from Trinidad and Tobago
13.9%
UNEMPLOYMENT AMONG AGES 20 TO 24 YEARS
0.0/ 100
METRIC RATING
333rd/ 347
METRIC RANK
12.8%
UNEMPLOYMENT AMONG AGES 20 TO 24 YEARS
0.0/ 100
METRIC RATING
317th/ 347
METRIC RANK
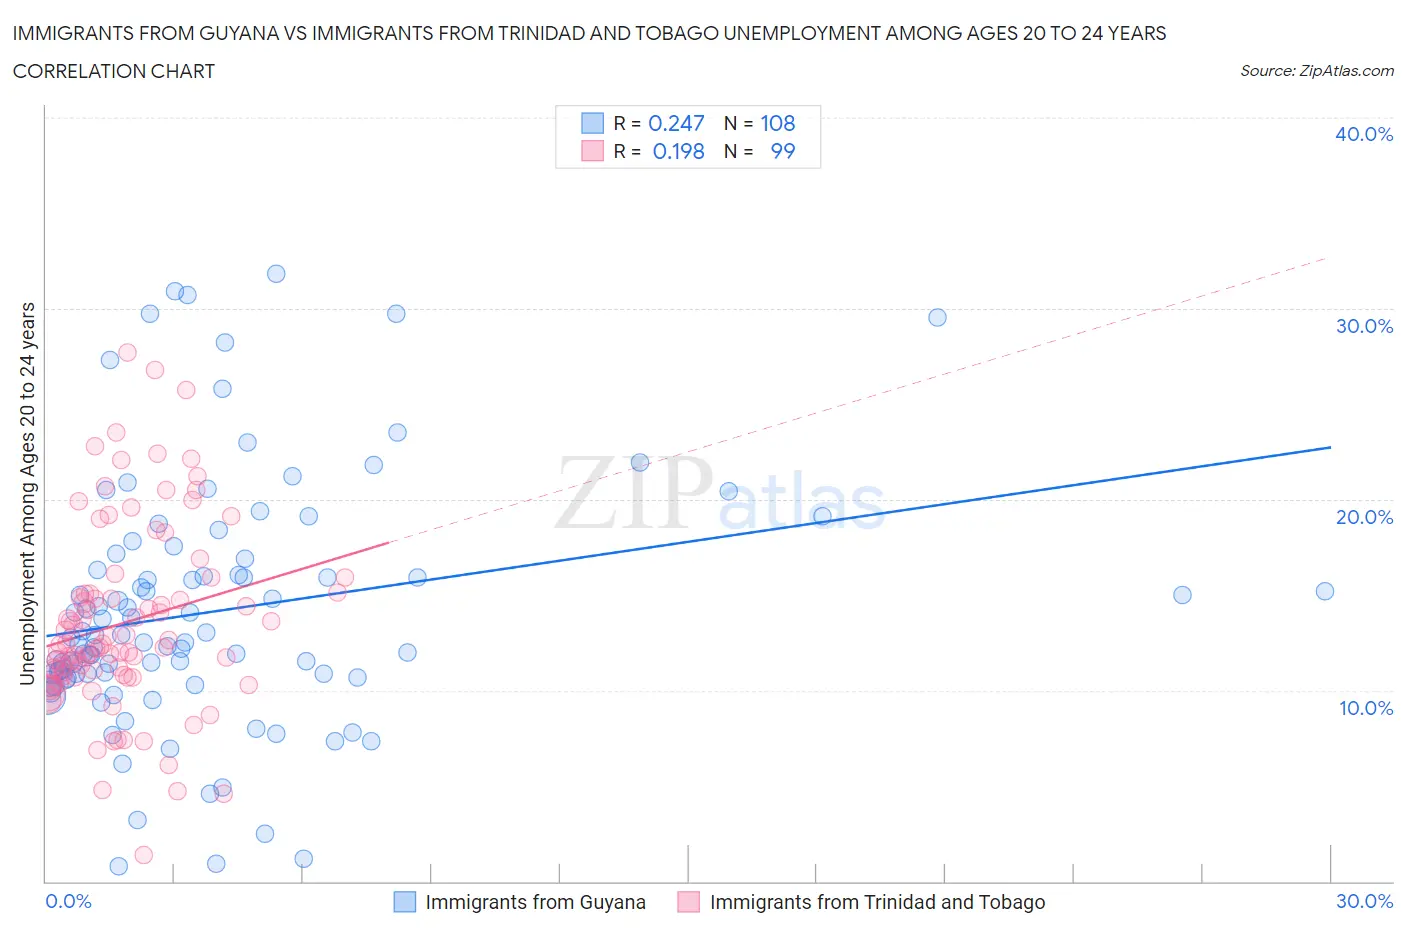
Immigrants from Guyana vs Immigrants from Trinidad and Tobago Unemployment Among Ages 20 to 24 years Correlation Chart
The statistical analysis conducted on geographies consisting of 181,344,797 people shows a weak positive correlation between the proportion of Immigrants from Guyana and unemployment rate among population between the ages 20 and 24 in the United States with a correlation coefficient (R) of 0.247 and weighted average of 13.9%. Similarly, the statistical analysis conducted on geographies consisting of 220,132,241 people shows a poor positive correlation between the proportion of Immigrants from Trinidad and Tobago and unemployment rate among population between the ages 20 and 24 in the United States with a correlation coefficient (R) of 0.198 and weighted average of 12.8%, a difference of 8.4%.
Unemployment Among Ages 20 to 24 years Correlation Summary
| Measurement | Immigrants from Guyana | Immigrants from Trinidad and Tobago |
| Minimum | 0.80% | 1.4% |
| Maximum | 31.8% | 27.7% |
| Range | 31.0% | 26.3% |
| Mean | 14.1% | 13.6% |
| Median | 12.6% | 12.4% |
| Interquartile 25% (IQ1) | 10.8% | 10.7% |
| Interquartile 75% (IQ3) | 16.6% | 15.1% |
| Interquartile Range (IQR) | 5.8% | 4.3% |
| Standard Deviation (Sample) | 6.5% | 4.9% |
| Standard Deviation (Population) | 6.5% | 4.9% |
Demographics Similar to Immigrants from Guyana and Immigrants from Trinidad and Tobago by Unemployment Among Ages 20 to 24 years
In terms of unemployment among ages 20 to 24 years, the demographic groups most similar to Immigrants from Guyana are Guyanese (14.0%, a difference of 0.50%), Immigrants from Grenada (13.8%, a difference of 0.52%), Aleut (13.8%, a difference of 0.58%), Arapaho (13.8%, a difference of 0.85%), and Dominican (13.8%, a difference of 0.93%). Similarly, the demographic groups most similar to Immigrants from Trinidad and Tobago are Immigrants from Dominica (12.8%, a difference of 0.12%), Barbadian (12.9%, a difference of 0.25%), Trinidadian and Tobagonian (12.9%, a difference of 0.51%), West Indian (12.8%, a difference of 0.60%), and Cheyenne (13.0%, a difference of 0.93%).
| Demographics | Rating | Rank | Unemployment Among Ages 20 to 24 years |
| West Indians | 0.0 /100 | #315 | Tragic 12.8% |
| Immigrants | Dominica | 0.0 /100 | #316 | Tragic 12.8% |
| Immigrants | Trinidad and Tobago | 0.0 /100 | #317 | Tragic 12.8% |
| Barbadians | 0.0 /100 | #318 | Tragic 12.9% |
| Trinidadians and Tobagonians | 0.0 /100 | #319 | Tragic 12.9% |
| Cheyenne | 0.0 /100 | #320 | Tragic 13.0% |
| Immigrants | Jamaica | 0.0 /100 | #321 | Tragic 13.0% |
| Natives/Alaskans | 0.0 /100 | #322 | Tragic 13.0% |
| Yakama | 0.0 /100 | #323 | Tragic 13.1% |
| Alaska Natives | 0.0 /100 | #324 | Tragic 13.2% |
| Pueblo | 0.0 /100 | #325 | Tragic 13.2% |
| Immigrants | Barbados | 0.0 /100 | #326 | Tragic 13.5% |
| Immigrants | Dominican Republic | 0.0 /100 | #327 | Tragic 13.6% |
| British West Indians | 0.0 /100 | #328 | Tragic 13.7% |
| Dominicans | 0.0 /100 | #329 | Tragic 13.8% |
| Arapaho | 0.0 /100 | #330 | Tragic 13.8% |
| Aleuts | 0.0 /100 | #331 | Tragic 13.8% |
| Immigrants | Grenada | 0.0 /100 | #332 | Tragic 13.8% |
| Immigrants | Guyana | 0.0 /100 | #333 | Tragic 13.9% |
| Guyanese | 0.0 /100 | #334 | Tragic 14.0% |
| Sioux | 0.0 /100 | #335 | Tragic 14.2% |