Liberian vs Native/Alaskan Unemployment Among Seniors over 65 years
COMPARE
Liberian
Native/Alaskan
Unemployment Among Seniors over 65 years
Unemployment Among Seniors over 65 years Comparison
Liberians
Natives/Alaskans
5.6%
UNEMPLOYMENT AMONG SENIORS OVER 65 YEARS
0.0/ 100
METRIC RATING
304th/ 347
METRIC RANK
5.8%
UNEMPLOYMENT AMONG SENIORS OVER 65 YEARS
0.0/ 100
METRIC RATING
322nd/ 347
METRIC RANK
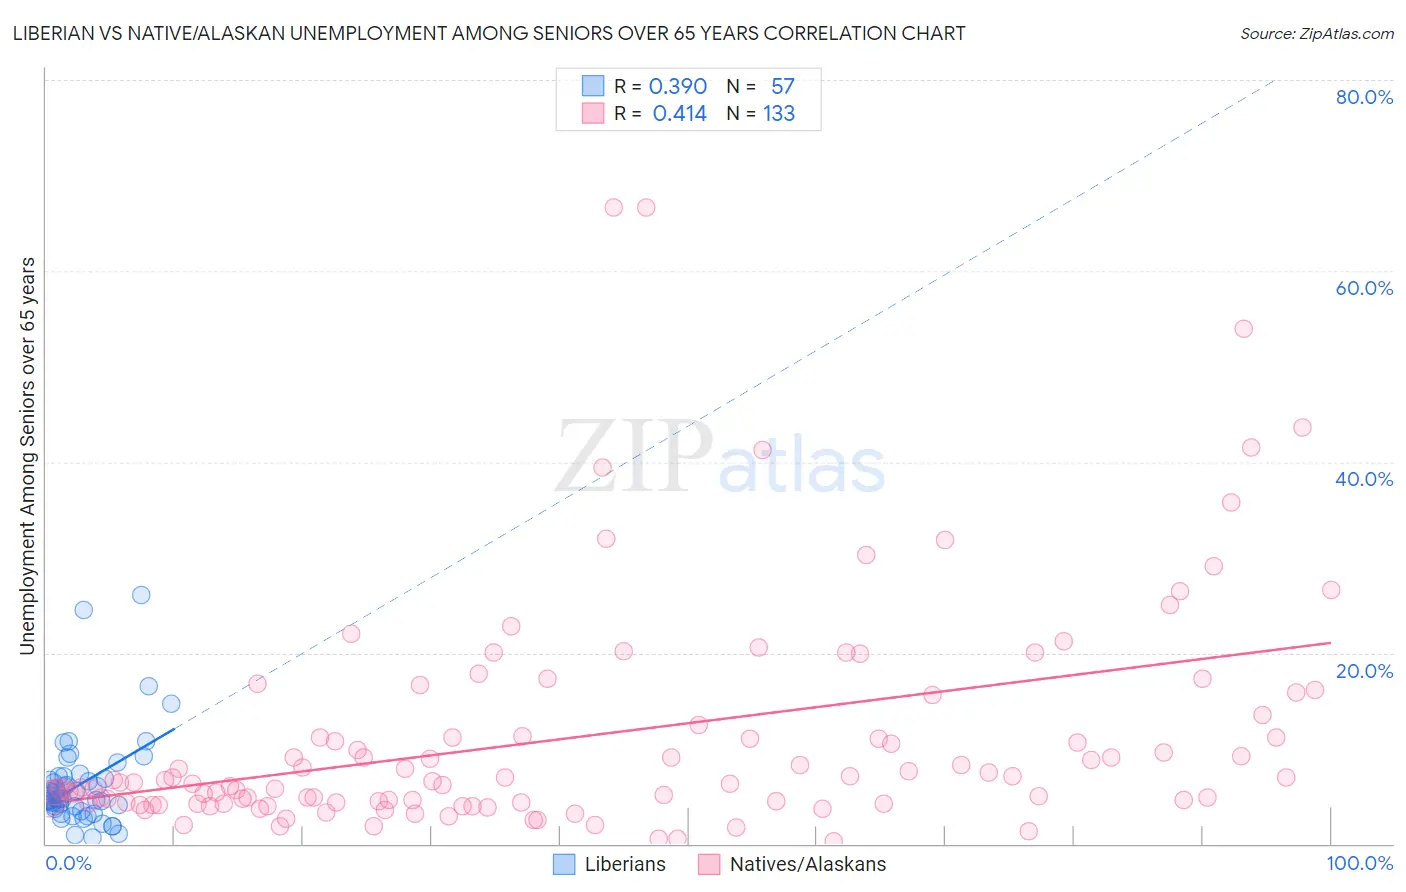
Liberian vs Native/Alaskan Unemployment Among Seniors over 65 years Correlation Chart
The statistical analysis conducted on geographies consisting of 113,645,931 people shows a mild positive correlation between the proportion of Liberians and unemployment rate amomg seniors over the age of 65 in the United States with a correlation coefficient (R) of 0.390 and weighted average of 5.6%. Similarly, the statistical analysis conducted on geographies consisting of 433,164,375 people shows a moderate positive correlation between the proportion of Natives/Alaskans and unemployment rate amomg seniors over the age of 65 in the United States with a correlation coefficient (R) of 0.414 and weighted average of 5.8%, a difference of 3.2%.
Unemployment Among Seniors over 65 years Correlation Summary
| Measurement | Liberian | Native/Alaskan |
| Minimum | 0.70% | 0.30% |
| Maximum | 26.1% | 66.6% |
| Range | 25.4% | 66.3% |
| Mean | 6.2% | 11.3% |
| Median | 4.7% | 6.5% |
| Interquartile 25% (IQ1) | 3.8% | 4.3% |
| Interquartile 75% (IQ3) | 6.9% | 12.9% |
| Interquartile Range (IQR) | 3.1% | 8.7% |
| Standard Deviation (Sample) | 4.8% | 12.1% |
| Standard Deviation (Population) | 4.7% | 12.0% |
Demographics Similar to Liberians and Natives/Alaskans by Unemployment Among Seniors over 65 years
In terms of unemployment among seniors over 65 years, the demographic groups most similar to Liberians are Immigrants from Latin America (5.6%, a difference of 0.070%), Mexican (5.6%, a difference of 0.16%), Ecuadorian (5.6%, a difference of 0.21%), Portuguese (5.6%, a difference of 0.25%), and Immigrants from St. Vincent and the Grenadines (5.6%, a difference of 0.34%). Similarly, the demographic groups most similar to Natives/Alaskans are British West Indian (5.8%, a difference of 0.080%), Immigrants from Dominica (5.8%, a difference of 0.34%), Immigrants from Mexico (5.7%, a difference of 0.72%), Immigrants from Bangladesh (5.7%, a difference of 0.88%), and Vietnamese (5.7%, a difference of 1.1%).
| Demographics | Rating | Rank | Unemployment Among Seniors over 65 years |
| Immigrants | Latin America | 0.0 /100 | #303 | Tragic 5.6% |
| Liberians | 0.0 /100 | #304 | Tragic 5.6% |
| Mexicans | 0.0 /100 | #305 | Tragic 5.6% |
| Ecuadorians | 0.0 /100 | #306 | Tragic 5.6% |
| Portuguese | 0.0 /100 | #307 | Tragic 5.6% |
| Immigrants | St. Vincent and the Grenadines | 0.0 /100 | #308 | Tragic 5.6% |
| Immigrants | Guatemala | 0.0 /100 | #309 | Tragic 5.6% |
| Salvadorans | 0.0 /100 | #310 | Tragic 5.6% |
| Immigrants | Guyana | 0.0 /100 | #311 | Tragic 5.6% |
| Immigrants | Ecuador | 0.0 /100 | #312 | Tragic 5.6% |
| Barbadians | 0.0 /100 | #313 | Tragic 5.6% |
| Delaware | 0.0 /100 | #314 | Tragic 5.7% |
| Immigrants | El Salvador | 0.0 /100 | #315 | Tragic 5.7% |
| Immigrants | Central America | 0.0 /100 | #316 | Tragic 5.7% |
| Immigrants | Bahamas | 0.0 /100 | #317 | Tragic 5.7% |
| Vietnamese | 0.0 /100 | #318 | Tragic 5.7% |
| Immigrants | Bangladesh | 0.0 /100 | #319 | Tragic 5.7% |
| Immigrants | Mexico | 0.0 /100 | #320 | Tragic 5.7% |
| British West Indians | 0.0 /100 | #321 | Tragic 5.8% |
| Natives/Alaskans | 0.0 /100 | #322 | Tragic 5.8% |
| Immigrants | Dominica | 0.0 /100 | #323 | Tragic 5.8% |