Immigrants from Peru vs Guamanian/Chamorro Unemployment Among Ages 65 to 74 years
COMPARE
Immigrants from Peru
Guamanian/Chamorro
Unemployment Among Ages 65 to 74 years
Unemployment Among Ages 65 to 74 years Comparison
Immigrants from Peru
Guamanians/Chamorros
5.6%
UNEMPLOYMENT AMONG AGES 65 TO 74 YEARS
1.3/ 100
METRIC RATING
243rd/ 347
METRIC RANK
5.4%
UNEMPLOYMENT AMONG AGES 65 TO 74 YEARS
42.1/ 100
METRIC RATING
179th/ 347
METRIC RANK
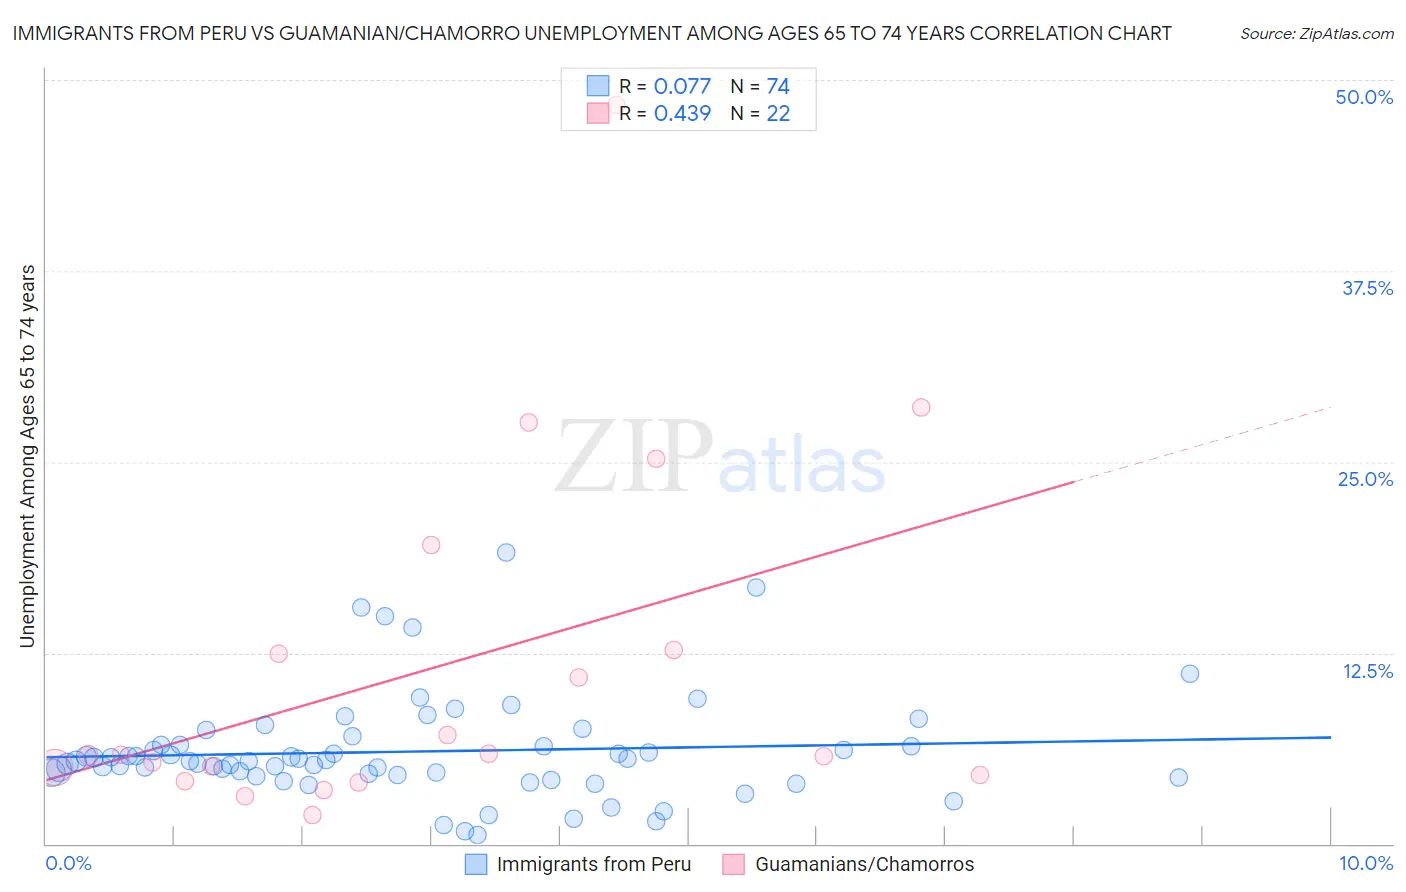
Immigrants from Peru vs Guamanian/Chamorro Unemployment Among Ages 65 to 74 years Correlation Chart
The statistical analysis conducted on geographies consisting of 299,952,352 people shows a slight positive correlation between the proportion of Immigrants from Peru and unemployment rate among population between the ages 65 and 74 in the United States with a correlation coefficient (R) of 0.077 and weighted average of 5.6%. Similarly, the statistical analysis conducted on geographies consisting of 205,325,278 people shows a moderate positive correlation between the proportion of Guamanians/Chamorros and unemployment rate among population between the ages 65 and 74 in the United States with a correlation coefficient (R) of 0.439 and weighted average of 5.4%, a difference of 3.3%.
Unemployment Among Ages 65 to 74 years Correlation Summary
| Measurement | Immigrants from Peru | Guamanian/Chamorro |
| Minimum | 0.60% | 1.9% |
| Maximum | 19.1% | 48.4% |
| Range | 18.5% | 46.5% |
| Mean | 6.0% | 11.5% |
| Median | 5.4% | 5.8% |
| Interquartile 25% (IQ1) | 4.5% | 4.5% |
| Interquartile 75% (IQ3) | 6.5% | 12.7% |
| Interquartile Range (IQR) | 1.9% | 8.2% |
| Standard Deviation (Sample) | 3.4% | 11.6% |
| Standard Deviation (Population) | 3.4% | 11.3% |
Similar Demographics by Unemployment Among Ages 65 to 74 years
Demographics Similar to Immigrants from Peru by Unemployment Among Ages 65 to 74 years
In terms of unemployment among ages 65 to 74 years, the demographic groups most similar to Immigrants from Peru are Cree (5.6%, a difference of 0.060%), Immigrants from Ghana (5.6%, a difference of 0.060%), Ghanaian (5.6%, a difference of 0.090%), German Russian (5.5%, a difference of 0.19%), and Cajun (5.5%, a difference of 0.27%).
| Demographics | Rating | Rank | Unemployment Among Ages 65 to 74 years |
| Hopi | 2.2 /100 | #236 | Tragic 5.5% |
| Immigrants | Belize | 2.2 /100 | #237 | Tragic 5.5% |
| Cajuns | 1.8 /100 | #238 | Tragic 5.5% |
| German Russians | 1.6 /100 | #239 | Tragic 5.5% |
| Ghanaians | 1.4 /100 | #240 | Tragic 5.6% |
| Cree | 1.4 /100 | #241 | Tragic 5.6% |
| Immigrants | Ghana | 1.4 /100 | #242 | Tragic 5.6% |
| Immigrants | Peru | 1.3 /100 | #243 | Tragic 5.6% |
| Immigrants | Micronesia | 0.9 /100 | #244 | Tragic 5.6% |
| Immigrants | Greece | 0.9 /100 | #245 | Tragic 5.6% |
| Paraguayans | 0.9 /100 | #246 | Tragic 5.6% |
| Immigrants | Immigrants | 0.9 /100 | #247 | Tragic 5.6% |
| Immigrants | Argentina | 0.9 /100 | #248 | Tragic 5.6% |
| Trinidadians and Tobagonians | 0.8 /100 | #249 | Tragic 5.6% |
| Cape Verdeans | 0.7 /100 | #250 | Tragic 5.6% |
Demographics Similar to Guamanians/Chamorros by Unemployment Among Ages 65 to 74 years
In terms of unemployment among ages 65 to 74 years, the demographic groups most similar to Guamanians/Chamorros are Immigrants from Ireland (5.4%, a difference of 0.0%), French (5.4%, a difference of 0.030%), Soviet Union (5.4%, a difference of 0.070%), Spanish American (5.4%, a difference of 0.14%), and Arab (5.4%, a difference of 0.16%).
| Demographics | Rating | Rank | Unemployment Among Ages 65 to 74 years |
| Greeks | 51.1 /100 | #172 | Average 5.4% |
| Immigrants | Northern Europe | 51.1 /100 | #173 | Average 5.4% |
| Potawatomi | 50.0 /100 | #174 | Average 5.4% |
| Immigrants | Iran | 49.0 /100 | #175 | Average 5.4% |
| Immigrants | Western Europe | 47.3 /100 | #176 | Average 5.4% |
| Arabs | 46.8 /100 | #177 | Average 5.4% |
| French | 43.1 /100 | #178 | Average 5.4% |
| Guamanians/Chamorros | 42.1 /100 | #179 | Average 5.4% |
| Immigrants | Ireland | 42.0 /100 | #180 | Average 5.4% |
| Soviet Union | 40.0 /100 | #181 | Fair 5.4% |
| Spanish Americans | 38.2 /100 | #182 | Fair 5.4% |
| Immigrants | Spain | 37.3 /100 | #183 | Fair 5.4% |
| Immigrants | Senegal | 35.2 /100 | #184 | Fair 5.4% |
| Russians | 34.4 /100 | #185 | Fair 5.4% |
| Lithuanians | 32.4 /100 | #186 | Fair 5.4% |