Latvian vs Kiowa Unemployment Among Ages 16 to 19 years
COMPARE
Latvian
Kiowa
Unemployment Among Ages 16 to 19 years
Unemployment Among Ages 16 to 19 years Comparison
Latvians
Kiowa
16.7%
UNEMPLOYMENT AMONG AGES 16 TO 19 YEARS
98.5/ 100
METRIC RATING
71st/ 347
METRIC RANK
25.2%
UNEMPLOYMENT AMONG AGES 16 TO 19 YEARS
0.0/ 100
METRIC RATING
336th/ 347
METRIC RANK
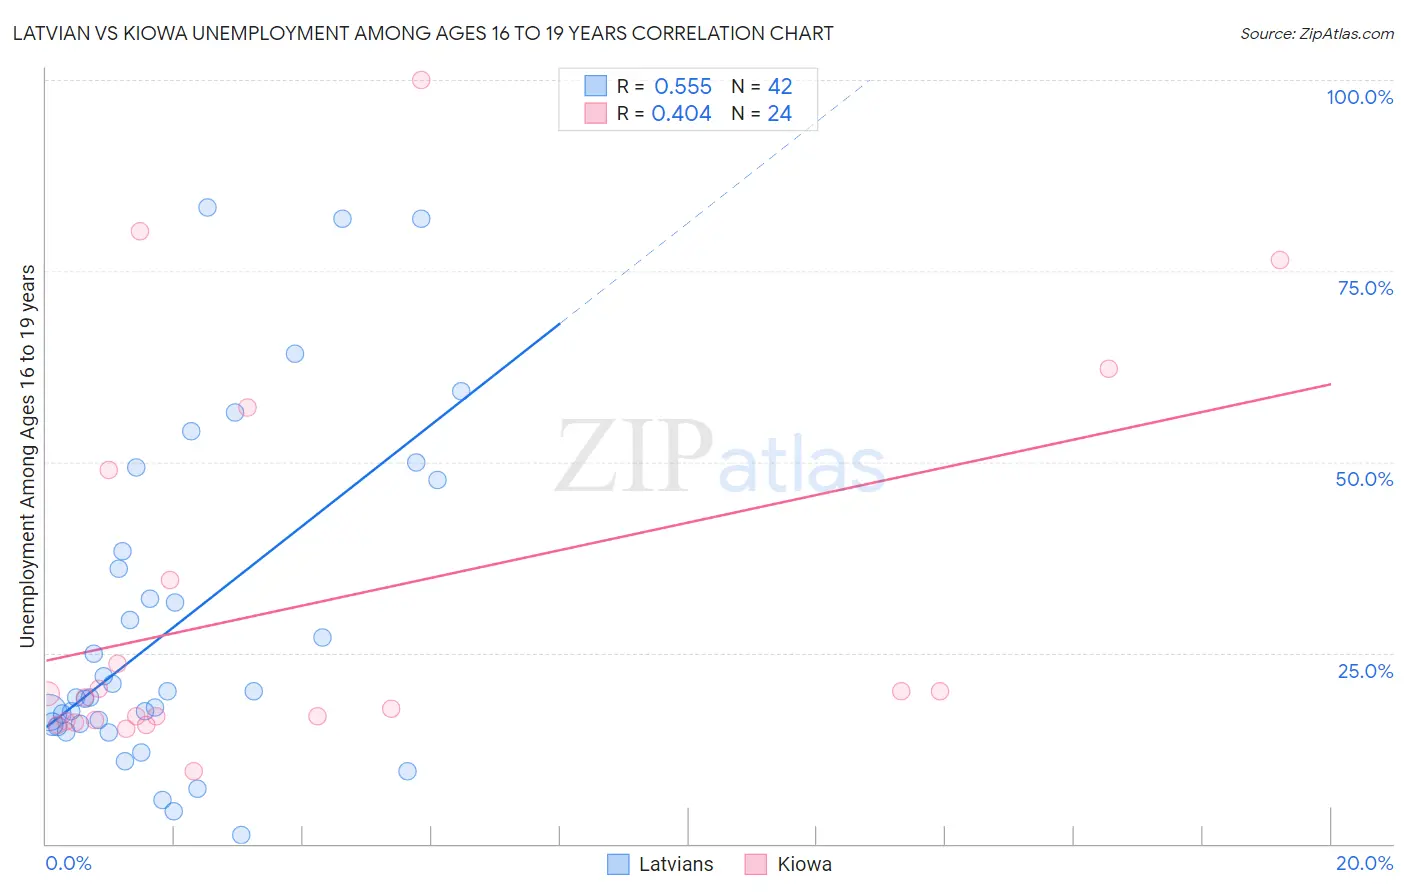
Latvian vs Kiowa Unemployment Among Ages 16 to 19 years Correlation Chart
The statistical analysis conducted on geographies consisting of 211,944,479 people shows a substantial positive correlation between the proportion of Latvians and unemployment rate among population between the ages 16 and 19 in the United States with a correlation coefficient (R) of 0.555 and weighted average of 16.7%. Similarly, the statistical analysis conducted on geographies consisting of 55,446,259 people shows a moderate positive correlation between the proportion of Kiowa and unemployment rate among population between the ages 16 and 19 in the United States with a correlation coefficient (R) of 0.404 and weighted average of 25.2%, a difference of 50.9%.
Unemployment Among Ages 16 to 19 years Correlation Summary
| Measurement | Latvian | Kiowa |
| Minimum | 1.1% | 9.5% |
| Maximum | 83.3% | 100.0% |
| Range | 82.2% | 90.5% |
| Mean | 29.0% | 31.4% |
| Median | 19.6% | 19.4% |
| Interquartile 25% (IQ1) | 15.7% | 16.1% |
| Interquartile 75% (IQ3) | 38.4% | 41.7% |
| Interquartile Range (IQR) | 22.7% | 25.6% |
| Standard Deviation (Sample) | 21.6% | 25.2% |
| Standard Deviation (Population) | 21.4% | 24.6% |
Similar Demographics by Unemployment Among Ages 16 to 19 years
Demographics Similar to Latvians by Unemployment Among Ages 16 to 19 years
In terms of unemployment among ages 16 to 19 years, the demographic groups most similar to Latvians are Immigrants from Canada (16.7%, a difference of 0.040%), Austrian (16.7%, a difference of 0.060%), Serbian (16.7%, a difference of 0.13%), Slavic (16.7%, a difference of 0.20%), and Chickasaw (16.7%, a difference of 0.20%).
| Demographics | Rating | Rank | Unemployment Among Ages 16 to 19 years |
| Northern Europeans | 99.0 /100 | #64 | Exceptional 16.6% |
| Immigrants | Japan | 98.9 /100 | #65 | Exceptional 16.6% |
| Okinawans | 98.9 /100 | #66 | Exceptional 16.6% |
| Slavs | 98.7 /100 | #67 | Exceptional 16.7% |
| Chickasaw | 98.7 /100 | #68 | Exceptional 16.7% |
| Serbians | 98.7 /100 | #69 | Exceptional 16.7% |
| Austrians | 98.6 /100 | #70 | Exceptional 16.7% |
| Latvians | 98.5 /100 | #71 | Exceptional 16.7% |
| Immigrants | Canada | 98.5 /100 | #72 | Exceptional 16.7% |
| Lithuanians | 98.2 /100 | #73 | Exceptional 16.7% |
| Immigrants | Eastern Africa | 98.1 /100 | #74 | Exceptional 16.8% |
| New Zealanders | 98.0 /100 | #75 | Exceptional 16.8% |
| Immigrants | North America | 97.9 /100 | #76 | Exceptional 16.8% |
| Immigrants | Singapore | 97.8 /100 | #77 | Exceptional 16.8% |
| Soviet Union | 97.8 /100 | #78 | Exceptional 16.8% |
Demographics Similar to Kiowa by Unemployment Among Ages 16 to 19 years
In terms of unemployment among ages 16 to 19 years, the demographic groups most similar to Kiowa are Arapaho (25.2%, a difference of 0.21%), Immigrants from Guyana (25.5%, a difference of 1.1%), Guyanese (24.8%, a difference of 1.5%), Immigrants from St. Vincent and the Grenadines (25.7%, a difference of 1.9%), and Immigrants from Grenada (25.7%, a difference of 2.1%).
| Demographics | Rating | Rank | Unemployment Among Ages 16 to 19 years |
| Tlingit-Haida | 0.0 /100 | #329 | Tragic 23.5% |
| Dominicans | 0.0 /100 | #330 | Tragic 23.6% |
| British West Indians | 0.0 /100 | #331 | Tragic 24.0% |
| Immigrants | Barbados | 0.0 /100 | #332 | Tragic 24.0% |
| Paiute | 0.0 /100 | #333 | Tragic 24.4% |
| Guyanese | 0.0 /100 | #334 | Tragic 24.8% |
| Arapaho | 0.0 /100 | #335 | Tragic 25.2% |
| Kiowa | 0.0 /100 | #336 | Tragic 25.2% |
| Immigrants | Guyana | 0.0 /100 | #337 | Tragic 25.5% |
| Immigrants | St. Vincent and the Grenadines | 0.0 /100 | #338 | Tragic 25.7% |
| Immigrants | Grenada | 0.0 /100 | #339 | Tragic 25.7% |
| Crow | 0.0 /100 | #340 | Tragic 26.2% |
| Puerto Ricans | 0.0 /100 | #341 | Tragic 27.5% |
| Inupiat | 0.0 /100 | #342 | Tragic 28.1% |
| Navajo | 0.0 /100 | #343 | Tragic 29.0% |