Nigerian vs Immigrants from Switzerland Unemployment Among Ages 25 to 29 years
COMPARE
Nigerian
Immigrants from Switzerland
Unemployment Among Ages 25 to 29 years
Unemployment Among Ages 25 to 29 years Comparison
Nigerians
Immigrants from Switzerland
7.4%
UNEMPLOYMENT AMONG AGES 25 TO 29 YEARS
0.1/ 100
METRIC RATING
261st/ 347
METRIC RANK
6.3%
UNEMPLOYMENT AMONG AGES 25 TO 29 YEARS
96.0/ 100
METRIC RATING
79th/ 347
METRIC RANK
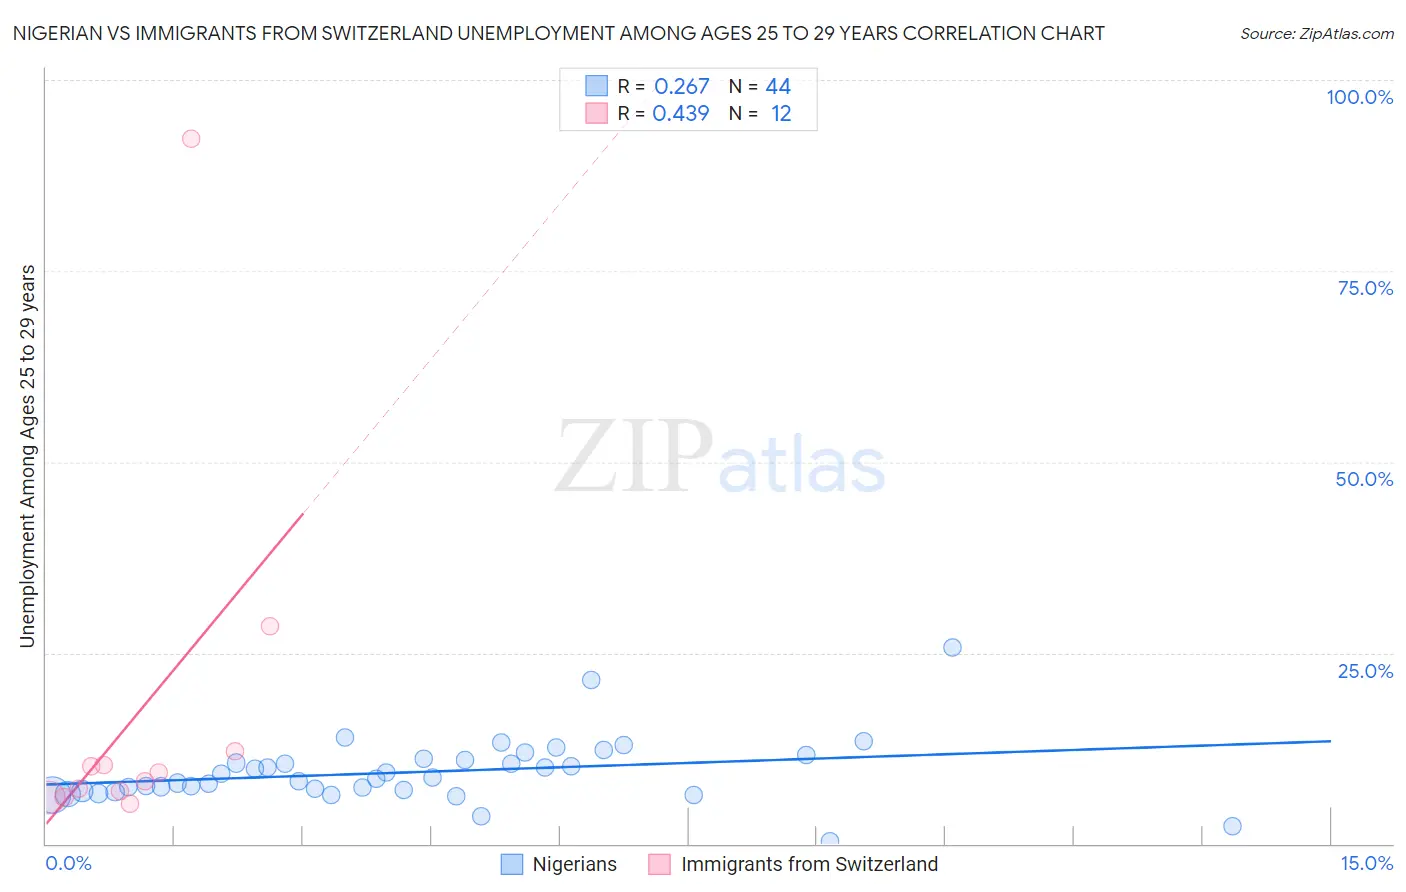
Nigerian vs Immigrants from Switzerland Unemployment Among Ages 25 to 29 years Correlation Chart
The statistical analysis conducted on geographies consisting of 322,821,029 people shows a weak positive correlation between the proportion of Nigerians and unemployment rate among population between the ages 25 and 29 in the United States with a correlation coefficient (R) of 0.267 and weighted average of 7.4%. Similarly, the statistical analysis conducted on geographies consisting of 144,055,678 people shows a moderate positive correlation between the proportion of Immigrants from Switzerland and unemployment rate among population between the ages 25 and 29 in the United States with a correlation coefficient (R) of 0.439 and weighted average of 6.3%, a difference of 16.7%.
Unemployment Among Ages 25 to 29 years Correlation Summary
| Measurement | Nigerian | Immigrants from Switzerland |
| Minimum | 0.40% | 5.3% |
| Maximum | 25.7% | 92.3% |
| Range | 25.3% | 87.0% |
| Mean | 9.4% | 16.9% |
| Median | 8.6% | 8.7% |
| Interquartile 25% (IQ1) | 7.0% | 6.5% |
| Interquartile 75% (IQ3) | 11.0% | 11.2% |
| Interquartile Range (IQR) | 4.1% | 4.7% |
| Standard Deviation (Sample) | 4.3% | 24.5% |
| Standard Deviation (Population) | 4.2% | 23.5% |
Similar Demographics by Unemployment Among Ages 25 to 29 years
Demographics Similar to Nigerians by Unemployment Among Ages 25 to 29 years
In terms of unemployment among ages 25 to 29 years, the demographic groups most similar to Nigerians are Ecuadorian (7.4%, a difference of 0.050%), American (7.4%, a difference of 0.080%), Kiowa (7.4%, a difference of 0.13%), Immigrants from Western Africa (7.4%, a difference of 0.22%), and Immigrants from Fiji (7.4%, a difference of 0.29%).
| Demographics | Rating | Rank | Unemployment Among Ages 25 to 29 years |
| Ghanaians | 0.3 /100 | #254 | Tragic 7.2% |
| Immigrants | Cameroon | 0.3 /100 | #255 | Tragic 7.2% |
| Mexican American Indians | 0.3 /100 | #256 | Tragic 7.3% |
| Assyrians/Chaldeans/Syriacs | 0.2 /100 | #257 | Tragic 7.3% |
| Ottawa | 0.1 /100 | #258 | Tragic 7.3% |
| Cree | 0.1 /100 | #259 | Tragic 7.3% |
| Americans | 0.1 /100 | #260 | Tragic 7.4% |
| Nigerians | 0.1 /100 | #261 | Tragic 7.4% |
| Ecuadorians | 0.1 /100 | #262 | Tragic 7.4% |
| Kiowa | 0.1 /100 | #263 | Tragic 7.4% |
| Immigrants | Western Africa | 0.1 /100 | #264 | Tragic 7.4% |
| Immigrants | Fiji | 0.1 /100 | #265 | Tragic 7.4% |
| Paiute | 0.1 /100 | #266 | Tragic 7.4% |
| Pennsylvania Germans | 0.1 /100 | #267 | Tragic 7.4% |
| Immigrants | Ecuador | 0.1 /100 | #268 | Tragic 7.4% |
Demographics Similar to Immigrants from Switzerland by Unemployment Among Ages 25 to 29 years
In terms of unemployment among ages 25 to 29 years, the demographic groups most similar to Immigrants from Switzerland are Immigrants from Romania (6.3%, a difference of 0.060%), Iranian (6.3%, a difference of 0.10%), Immigrants from Poland (6.3%, a difference of 0.14%), Asian (6.3%, a difference of 0.17%), and Icelander (6.3%, a difference of 0.27%).
| Demographics | Rating | Rank | Unemployment Among Ages 25 to 29 years |
| Scandinavians | 97.4 /100 | #72 | Exceptional 6.3% |
| Belgians | 97.0 /100 | #73 | Exceptional 6.3% |
| Carpatho Rusyns | 96.9 /100 | #74 | Exceptional 6.3% |
| Immigrants | Jordan | 96.8 /100 | #75 | Exceptional 6.3% |
| Immigrants | Korea | 96.7 /100 | #76 | Exceptional 6.3% |
| Icelanders | 96.6 /100 | #77 | Exceptional 6.3% |
| Asians | 96.4 /100 | #78 | Exceptional 6.3% |
| Immigrants | Switzerland | 96.0 /100 | #79 | Exceptional 6.3% |
| Immigrants | Romania | 95.9 /100 | #80 | Exceptional 6.3% |
| Iranians | 95.8 /100 | #81 | Exceptional 6.3% |
| Immigrants | Poland | 95.7 /100 | #82 | Exceptional 6.3% |
| Slovenes | 95.3 /100 | #83 | Exceptional 6.3% |
| Immigrants | Spain | 95.2 /100 | #84 | Exceptional 6.3% |
| Immigrants | Sweden | 95.1 /100 | #85 | Exceptional 6.3% |
| Immigrants | Asia | 94.9 /100 | #86 | Exceptional 6.3% |