Immigrants from Congo vs Finnish Female Unemployment
COMPARE
Immigrants from Congo
Finnish
Female Unemployment
Female Unemployment Comparison
Immigrants from Congo
Finns
5.3%
FEMALE UNEMPLOYMENT
43.1/ 100
METRIC RATING
180th/ 347
METRIC RANK
4.6%
FEMALE UNEMPLOYMENT
100.0/ 100
METRIC RATING
14th/ 347
METRIC RANK
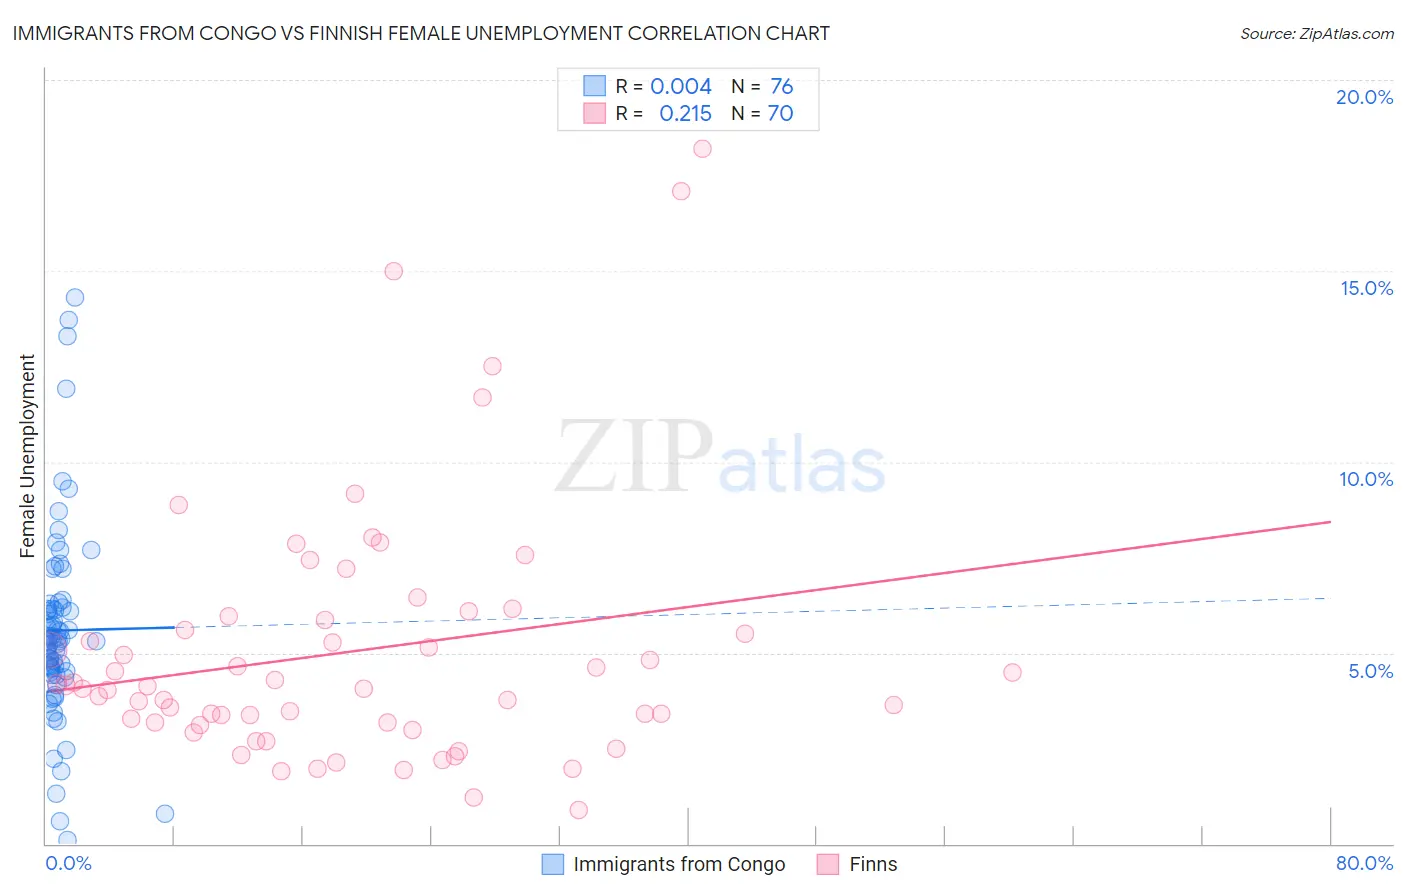
Immigrants from Congo vs Finnish Female Unemployment Correlation Chart
The statistical analysis conducted on geographies consisting of 92,074,429 people shows no correlation between the proportion of Immigrants from Congo and unemploymnet rate among females in the United States with a correlation coefficient (R) of 0.004 and weighted average of 5.3%. Similarly, the statistical analysis conducted on geographies consisting of 401,070,094 people shows a weak positive correlation between the proportion of Finns and unemploymnet rate among females in the United States with a correlation coefficient (R) of 0.215 and weighted average of 4.6%, a difference of 14.1%.
Female Unemployment Correlation Summary
| Measurement | Immigrants from Congo | Finnish |
| Minimum | 0.10% | 0.90% |
| Maximum | 14.3% | 18.2% |
| Range | 14.2% | 17.3% |
| Mean | 5.6% | 5.0% |
| Median | 5.3% | 4.1% |
| Interquartile 25% (IQ1) | 4.5% | 3.2% |
| Interquartile 75% (IQ3) | 6.2% | 5.9% |
| Interquartile Range (IQR) | 1.7% | 2.7% |
| Standard Deviation (Sample) | 2.6% | 3.4% |
| Standard Deviation (Population) | 2.5% | 3.3% |
Similar Demographics by Female Unemployment
Demographics Similar to Immigrants from Congo by Female Unemployment
In terms of female unemployment, the demographic groups most similar to Immigrants from Congo are Taiwanese (5.3%, a difference of 0.020%), Nonimmigrants (5.3%, a difference of 0.030%), Laotian (5.3%, a difference of 0.12%), Immigrants from Indonesia (5.3%, a difference of 0.15%), and Immigrants from Ukraine (5.3%, a difference of 0.18%).
| Demographics | Rating | Rank | Female Unemployment |
| Iranians | 50.4 /100 | #173 | Average 5.3% |
| Immigrants | Poland | 50.0 /100 | #174 | Average 5.3% |
| Immigrants | Laos | 47.5 /100 | #175 | Average 5.3% |
| Immigrants | Vietnam | 47.5 /100 | #176 | Average 5.3% |
| Immigrants | Morocco | 47.4 /100 | #177 | Average 5.3% |
| Immigrants | Southern Europe | 46.2 /100 | #178 | Average 5.3% |
| Laotians | 45.1 /100 | #179 | Average 5.3% |
| Immigrants | Congo | 43.1 /100 | #180 | Average 5.3% |
| Taiwanese | 42.7 /100 | #181 | Average 5.3% |
| Immigrants | Nonimmigrants | 42.6 /100 | #182 | Average 5.3% |
| Immigrants | Indonesia | 40.7 /100 | #183 | Average 5.3% |
| Immigrants | Ukraine | 40.1 /100 | #184 | Average 5.3% |
| Malaysians | 40.1 /100 | #185 | Average 5.3% |
| Immigrants | Belarus | 39.4 /100 | #186 | Fair 5.3% |
| Immigrants | Albania | 35.4 /100 | #187 | Fair 5.3% |
Demographics Similar to Finns by Female Unemployment
In terms of female unemployment, the demographic groups most similar to Finns are English (4.6%, a difference of 0.20%), Belgian (4.6%, a difference of 0.59%), Dutch (4.6%, a difference of 0.75%), Carpatho Rusyn (4.7%, a difference of 1.1%), and Croatian (4.7%, a difference of 1.1%).
| Demographics | Rating | Rank | Female Unemployment |
| Chinese | 100.0 /100 | #7 | Exceptional 4.5% |
| Germans | 100.0 /100 | #8 | Exceptional 4.5% |
| Slovenes | 100.0 /100 | #9 | Exceptional 4.5% |
| Swiss | 100.0 /100 | #10 | Exceptional 4.6% |
| Scandinavians | 100.0 /100 | #11 | Exceptional 4.6% |
| Dutch | 100.0 /100 | #12 | Exceptional 4.6% |
| Belgians | 100.0 /100 | #13 | Exceptional 4.6% |
| Finns | 100.0 /100 | #14 | Exceptional 4.6% |
| English | 100.0 /100 | #15 | Exceptional 4.6% |
| Carpatho Rusyns | 99.9 /100 | #16 | Exceptional 4.7% |
| Croatians | 99.9 /100 | #17 | Exceptional 4.7% |
| Latvians | 99.9 /100 | #18 | Exceptional 4.7% |
| Poles | 99.9 /100 | #19 | Exceptional 4.7% |
| Bulgarians | 99.9 /100 | #20 | Exceptional 4.7% |
| Fijians | 99.9 /100 | #21 | Exceptional 4.7% |