Scottish vs Barbadian Male Unemployment
COMPARE
Scottish
Barbadian
Male Unemployment
Male Unemployment Comparison
Scottish
Barbadians
4.8%
MALE UNEMPLOYMENT
99.8/ 100
METRIC RATING
29th/ 347
METRIC RANK
6.9%
MALE UNEMPLOYMENT
0.0/ 100
METRIC RATING
309th/ 347
METRIC RANK
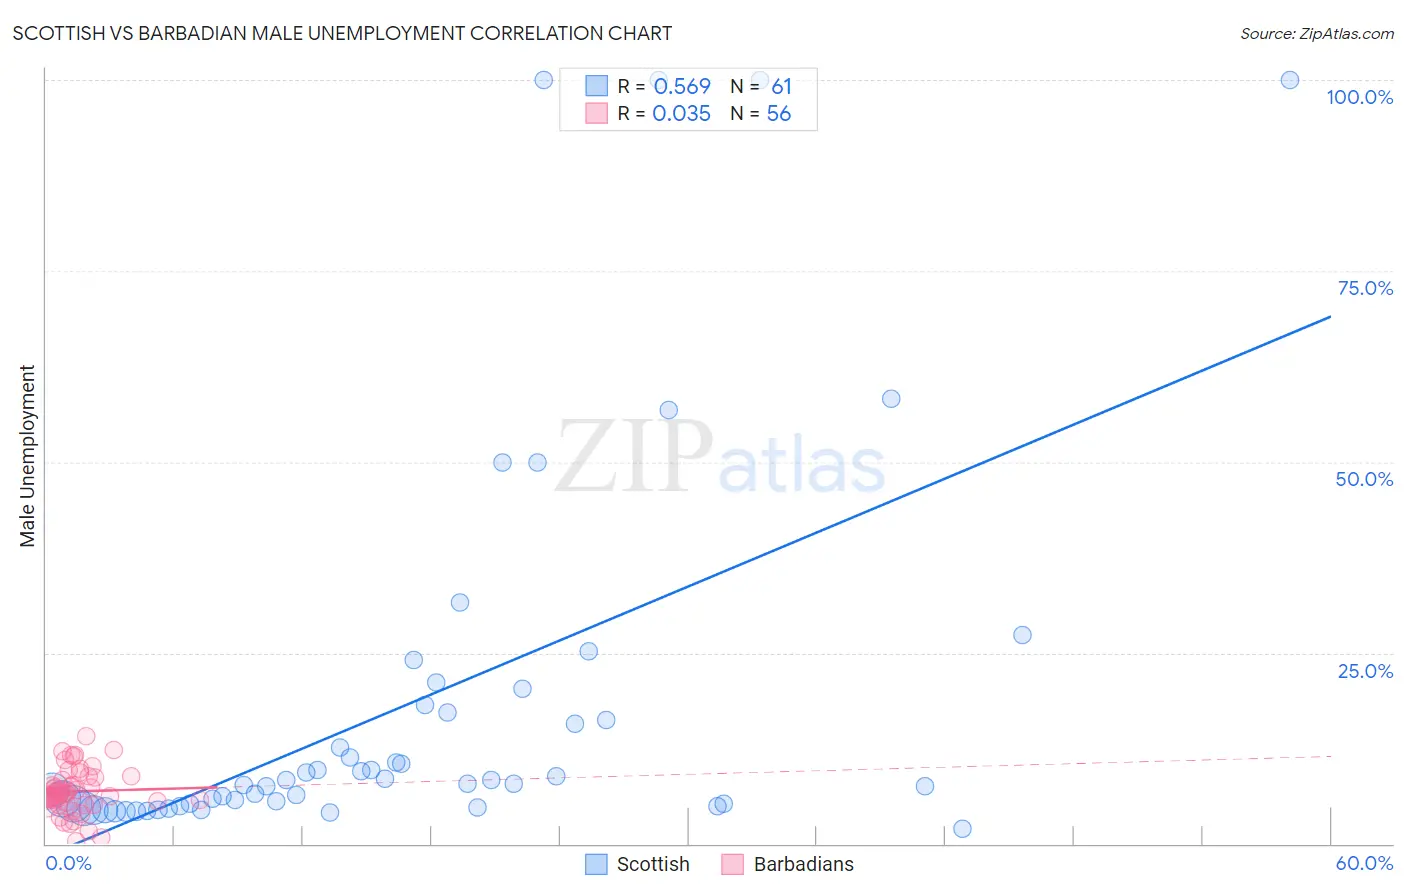
Scottish vs Barbadian Male Unemployment Correlation Chart
The statistical analysis conducted on geographies consisting of 556,190,347 people shows a substantial positive correlation between the proportion of Scottish and unemployment rate among males in the United States with a correlation coefficient (R) of 0.569 and weighted average of 4.8%. Similarly, the statistical analysis conducted on geographies consisting of 141,188,365 people shows no correlation between the proportion of Barbadians and unemployment rate among males in the United States with a correlation coefficient (R) of 0.035 and weighted average of 6.9%, a difference of 42.7%.
Male Unemployment Correlation Summary
| Measurement | Scottish | Barbadian |
| Minimum | 1.9% | 0.40% |
| Maximum | 100.0% | 14.0% |
| Range | 98.1% | 13.6% |
| Mean | 18.3% | 6.9% |
| Median | 7.9% | 6.5% |
| Interquartile 25% (IQ1) | 5.1% | 5.6% |
| Interquartile 75% (IQ3) | 17.7% | 8.5% |
| Interquartile Range (IQR) | 12.6% | 2.9% |
| Standard Deviation (Sample) | 25.2% | 2.8% |
| Standard Deviation (Population) | 25.0% | 2.8% |
Similar Demographics by Male Unemployment
Demographics Similar to Scottish by Male Unemployment
In terms of male unemployment, the demographic groups most similar to Scottish are Bulgarian (4.8%, a difference of 0.13%), British (4.8%, a difference of 0.31%), Belgian (4.8%, a difference of 0.32%), Dutch (4.8%, a difference of 0.52%), and Zimbabwean (4.8%, a difference of 0.54%).
| Demographics | Rating | Rank | Male Unemployment |
| Carpatho Rusyns | 99.9 /100 | #22 | Exceptional 4.8% |
| Tongans | 99.9 /100 | #23 | Exceptional 4.8% |
| Immigrants | South Central Asia | 99.9 /100 | #24 | Exceptional 4.8% |
| Zimbabweans | 99.9 /100 | #25 | Exceptional 4.8% |
| Dutch | 99.9 /100 | #26 | Exceptional 4.8% |
| Belgians | 99.9 /100 | #27 | Exceptional 4.8% |
| Bulgarians | 99.8 /100 | #28 | Exceptional 4.8% |
| Scottish | 99.8 /100 | #29 | Exceptional 4.8% |
| British | 99.8 /100 | #30 | Exceptional 4.8% |
| Sudanese | 99.8 /100 | #31 | Exceptional 4.8% |
| Immigrants | Nepal | 99.8 /100 | #32 | Exceptional 4.8% |
| Latvians | 99.7 /100 | #33 | Exceptional 4.8% |
| Welsh | 99.7 /100 | #34 | Exceptional 4.8% |
| Paraguayans | 99.5 /100 | #35 | Exceptional 4.9% |
| Immigrants | Singapore | 99.4 /100 | #36 | Exceptional 4.9% |
Demographics Similar to Barbadians by Male Unemployment
In terms of male unemployment, the demographic groups most similar to Barbadians are Aleut (6.8%, a difference of 0.41%), Black/African American (6.9%, a difference of 0.64%), Immigrants from Armenia (6.9%, a difference of 0.96%), Lumbee (6.9%, a difference of 1.2%), and Immigrants from Dominica (7.0%, a difference of 2.2%).
| Demographics | Rating | Rank | Male Unemployment |
| Ute | 0.0 /100 | #302 | Tragic 6.6% |
| Immigrants | West Indies | 0.0 /100 | #303 | Tragic 6.7% |
| West Indians | 0.0 /100 | #304 | Tragic 6.7% |
| Trinidadians and Tobagonians | 0.0 /100 | #305 | Tragic 6.7% |
| Immigrants | Trinidad and Tobago | 0.0 /100 | #306 | Tragic 6.7% |
| Immigrants | Jamaica | 0.0 /100 | #307 | Tragic 6.7% |
| Aleuts | 0.0 /100 | #308 | Tragic 6.8% |
| Barbadians | 0.0 /100 | #309 | Tragic 6.9% |
| Blacks/African Americans | 0.0 /100 | #310 | Tragic 6.9% |
| Immigrants | Armenia | 0.0 /100 | #311 | Tragic 6.9% |
| Lumbee | 0.0 /100 | #312 | Tragic 6.9% |
| Immigrants | Dominica | 0.0 /100 | #313 | Tragic 7.0% |
| Immigrants | Barbados | 0.0 /100 | #314 | Tragic 7.1% |
| Houma | 0.0 /100 | #315 | Tragic 7.1% |
| Immigrants | Guyana | 0.0 /100 | #316 | Tragic 7.1% |