Immigrants from Japan vs Immigrants from Uzbekistan Unemployment Among Ages 60 to 64 years
COMPARE
Immigrants from Japan
Immigrants from Uzbekistan
Unemployment Among Ages 60 to 64 years
Unemployment Among Ages 60 to 64 years Comparison
Immigrants from Japan
Immigrants from Uzbekistan
4.7%
UNEMPLOYMENT AMONG AGES 60 TO 64 YEARS
97.4/ 100
METRIC RATING
108th/ 347
METRIC RANK
5.1%
UNEMPLOYMENT AMONG AGES 60 TO 64 YEARS
0.4/ 100
METRIC RATING
262nd/ 347
METRIC RANK
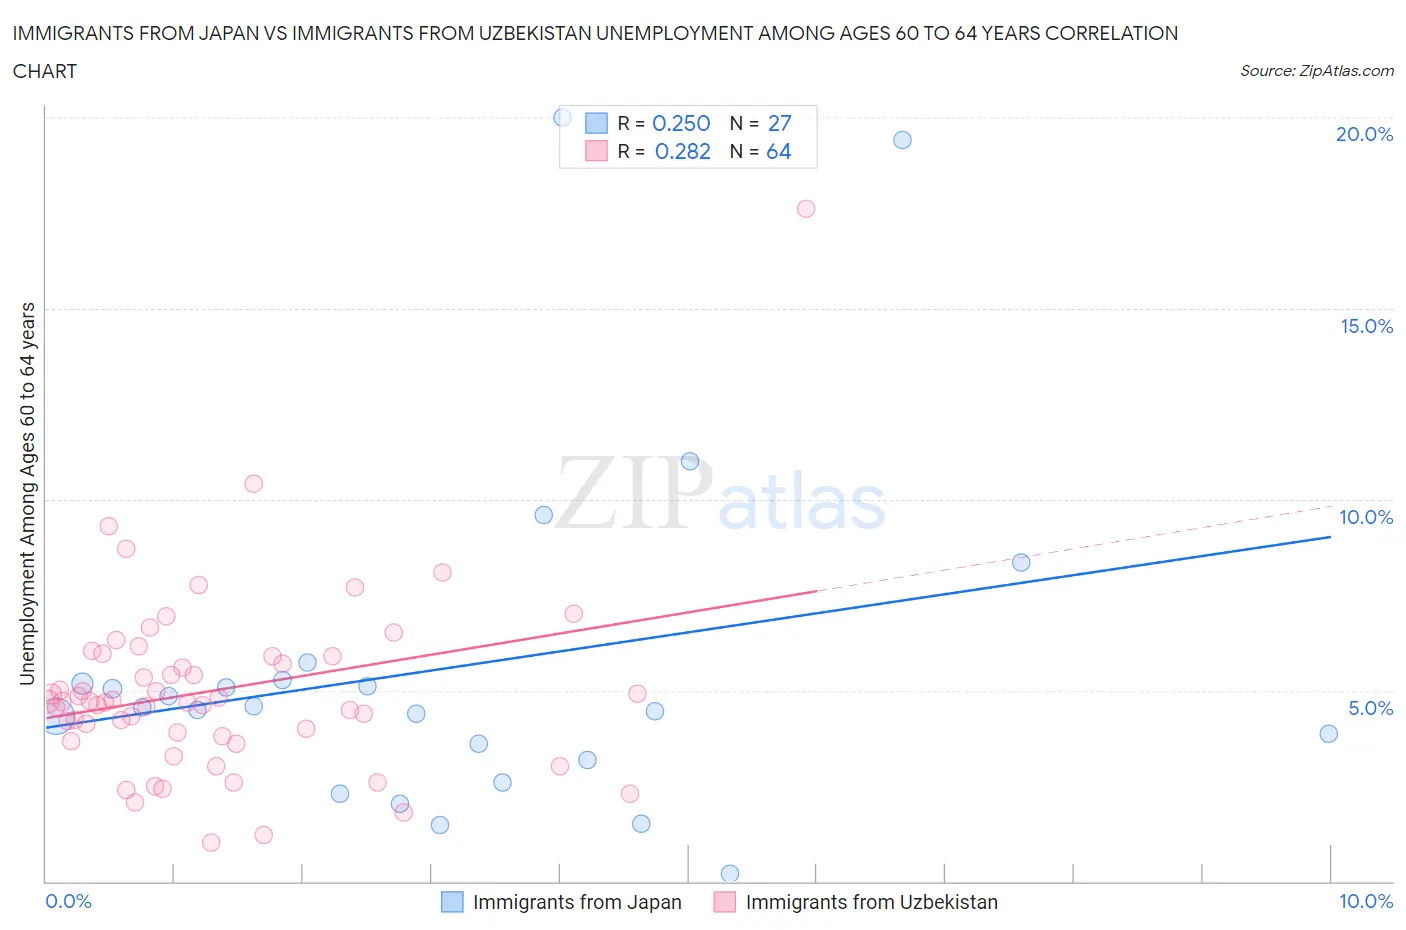
Immigrants from Japan vs Immigrants from Uzbekistan Unemployment Among Ages 60 to 64 years Correlation Chart
The statistical analysis conducted on geographies consisting of 313,646,876 people shows a weak positive correlation between the proportion of Immigrants from Japan and unemployment rate among population between the ages 60 and 64 in the United States with a correlation coefficient (R) of 0.250 and weighted average of 4.7%. Similarly, the statistical analysis conducted on geographies consisting of 115,082,688 people shows a weak positive correlation between the proportion of Immigrants from Uzbekistan and unemployment rate among population between the ages 60 and 64 in the United States with a correlation coefficient (R) of 0.282 and weighted average of 5.1%, a difference of 8.4%.
Unemployment Among Ages 60 to 64 years Correlation Summary
| Measurement | Immigrants from Japan | Immigrants from Uzbekistan |
| Minimum | 0.20% | 1.0% |
| Maximum | 20.0% | 17.6% |
| Range | 19.8% | 16.6% |
| Mean | 5.6% | 5.0% |
| Median | 4.6% | 4.7% |
| Interquartile 25% (IQ1) | 3.2% | 3.8% |
| Interquartile 75% (IQ3) | 5.3% | 5.9% |
| Interquartile Range (IQR) | 2.1% | 2.1% |
| Standard Deviation (Sample) | 4.7% | 2.4% |
| Standard Deviation (Population) | 4.6% | 2.4% |
Similar Demographics by Unemployment Among Ages 60 to 64 years
Demographics Similar to Immigrants from Japan by Unemployment Among Ages 60 to 64 years
In terms of unemployment among ages 60 to 64 years, the demographic groups most similar to Immigrants from Japan are Immigrants from Netherlands (4.7%, a difference of 0.0%), Greek (4.7%, a difference of 0.040%), Immigrants from North America (4.7%, a difference of 0.050%), Ethiopian (4.7%, a difference of 0.070%), and Canadian (4.7%, a difference of 0.080%).
| Demographics | Rating | Rank | Unemployment Among Ages 60 to 64 years |
| Malaysians | 97.9 /100 | #101 | Exceptional 4.7% |
| Immigrants | Canada | 97.8 /100 | #102 | Exceptional 4.7% |
| Whites/Caucasians | 97.8 /100 | #103 | Exceptional 4.7% |
| Paraguayans | 97.7 /100 | #104 | Exceptional 4.7% |
| Canadians | 97.7 /100 | #105 | Exceptional 4.7% |
| Immigrants | North America | 97.6 /100 | #106 | Exceptional 4.7% |
| Greeks | 97.5 /100 | #107 | Exceptional 4.7% |
| Immigrants | Japan | 97.4 /100 | #108 | Exceptional 4.7% |
| Immigrants | Netherlands | 97.4 /100 | #109 | Exceptional 4.7% |
| Ethiopians | 97.2 /100 | #110 | Exceptional 4.7% |
| French | 97.1 /100 | #111 | Exceptional 4.7% |
| Syrians | 97.0 /100 | #112 | Exceptional 4.7% |
| Bulgarians | 96.6 /100 | #113 | Exceptional 4.7% |
| Maltese | 96.5 /100 | #114 | Exceptional 4.7% |
| Immigrants | Romania | 96.4 /100 | #115 | Exceptional 4.7% |
Demographics Similar to Immigrants from Uzbekistan by Unemployment Among Ages 60 to 64 years
In terms of unemployment among ages 60 to 64 years, the demographic groups most similar to Immigrants from Uzbekistan are Immigrants (5.1%, a difference of 0.010%), Immigrants from Ghana (5.1%, a difference of 0.020%), Sioux (5.1%, a difference of 0.10%), Immigrants from Honduras (5.1%, a difference of 0.12%), and Honduran (5.1%, a difference of 0.25%).
| Demographics | Rating | Rank | Unemployment Among Ages 60 to 64 years |
| Estonians | 0.8 /100 | #255 | Tragic 5.1% |
| Immigrants | Peru | 0.7 /100 | #256 | Tragic 5.1% |
| Japanese | 0.6 /100 | #257 | Tragic 5.1% |
| Celtics | 0.5 /100 | #258 | Tragic 5.1% |
| Hondurans | 0.5 /100 | #259 | Tragic 5.1% |
| Immigrants | Honduras | 0.4 /100 | #260 | Tragic 5.1% |
| Immigrants | Ghana | 0.4 /100 | #261 | Tragic 5.1% |
| Immigrants | Uzbekistan | 0.4 /100 | #262 | Tragic 5.1% |
| Immigrants | Immigrants | 0.4 /100 | #263 | Tragic 5.1% |
| Sioux | 0.3 /100 | #264 | Tragic 5.1% |
| Immigrants | Argentina | 0.2 /100 | #265 | Tragic 5.1% |
| Immigrants | Australia | 0.2 /100 | #266 | Tragic 5.1% |
| Immigrants | Bahamas | 0.2 /100 | #267 | Tragic 5.1% |
| Central American Indians | 0.2 /100 | #268 | Tragic 5.1% |
| Immigrants | Costa Rica | 0.2 /100 | #269 | Tragic 5.1% |