Kenyan vs Subsaharan African Unemployment Among Seniors over 75 years
COMPARE
Kenyan
Subsaharan African
Unemployment Among Seniors over 75 years
Unemployment Among Seniors over 75 years Comparison
Kenyans
Sub-Saharan Africans
9.1%
UNEMPLOYMENT AMONG SENIORS OVER 75 YEARS
5.4/ 100
METRIC RATING
228th/ 347
METRIC RANK
9.2%
UNEMPLOYMENT AMONG SENIORS OVER 75 YEARS
2.3/ 100
METRIC RATING
247th/ 347
METRIC RANK
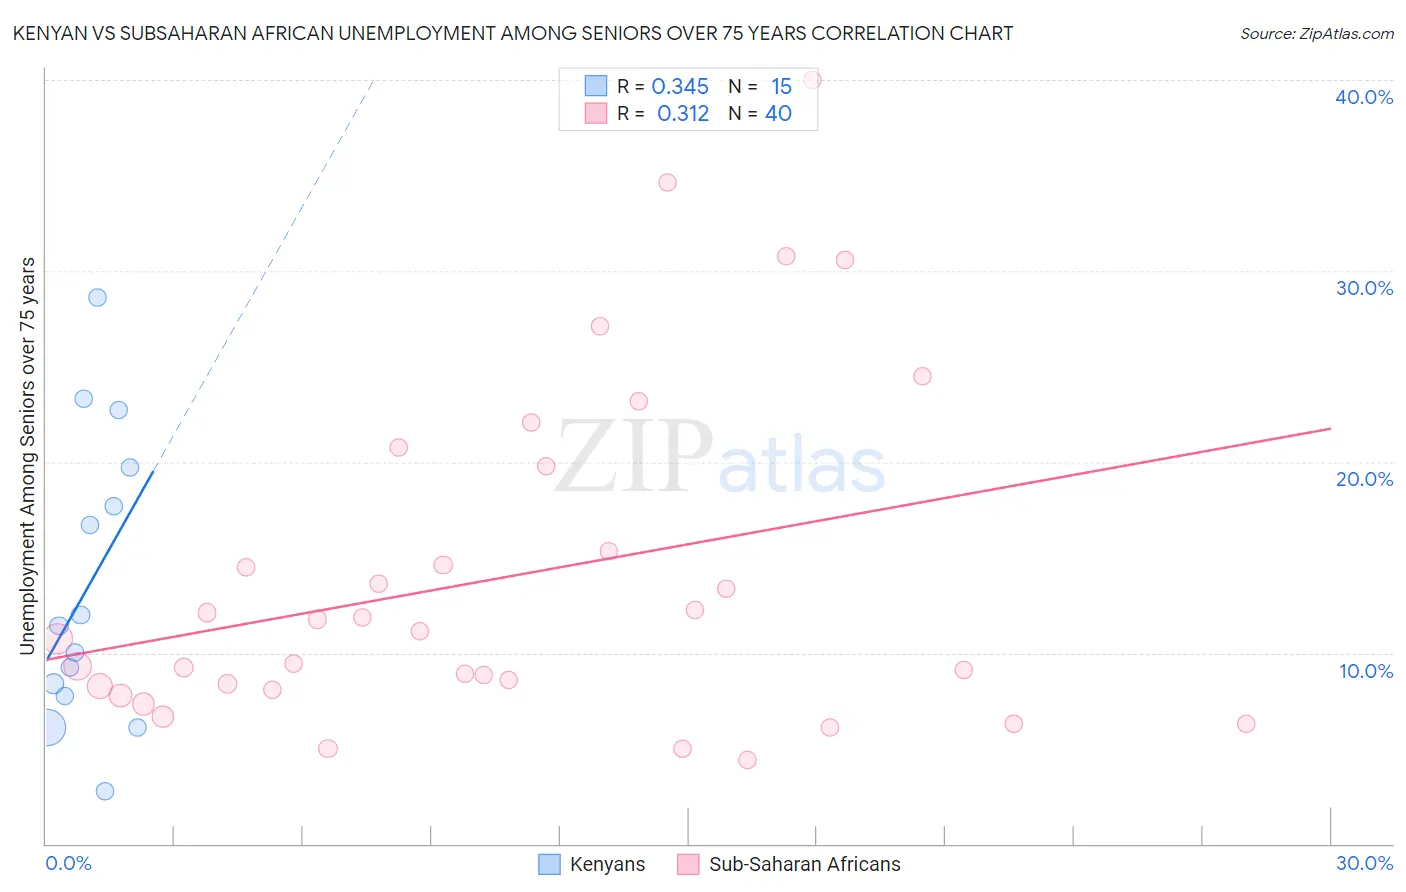
Kenyan vs Subsaharan African Unemployment Among Seniors over 75 years Correlation Chart
The statistical analysis conducted on geographies consisting of 111,094,632 people shows a mild positive correlation between the proportion of Kenyans and unemployment rate among seniors over the age of 75 in the United States with a correlation coefficient (R) of 0.345 and weighted average of 9.1%. Similarly, the statistical analysis conducted on geographies consisting of 227,990,978 people shows a mild positive correlation between the proportion of Sub-Saharan Africans and unemployment rate among seniors over the age of 75 in the United States with a correlation coefficient (R) of 0.312 and weighted average of 9.2%, a difference of 1.1%.
Unemployment Among Seniors over 75 years Correlation Summary
| Measurement | Kenyan | Subsaharan African |
| Minimum | 2.8% | 4.4% |
| Maximum | 28.6% | 40.0% |
| Range | 25.8% | 35.6% |
| Mean | 13.5% | 13.9% |
| Median | 11.4% | 10.9% |
| Interquartile 25% (IQ1) | 7.7% | 8.2% |
| Interquartile 75% (IQ3) | 19.7% | 17.5% |
| Interquartile Range (IQR) | 12.0% | 9.4% |
| Standard Deviation (Sample) | 7.5% | 8.8% |
| Standard Deviation (Population) | 7.3% | 8.7% |
Demographics Similar to Kenyans and Sub-Saharan Africans by Unemployment Among Seniors over 75 years
In terms of unemployment among seniors over 75 years, the demographic groups most similar to Kenyans are Samoan (9.1%, a difference of 0.060%), Hispanic or Latino (9.1%, a difference of 0.12%), Northern European (9.1%, a difference of 0.13%), Immigrants from Central America (9.1%, a difference of 0.13%), and African (9.1%, a difference of 0.15%). Similarly, the demographic groups most similar to Sub-Saharan Africans are Immigrants from North America (9.2%, a difference of 0.020%), Immigrants from Canada (9.2%, a difference of 0.14%), Immigrants from Germany (9.2%, a difference of 0.20%), Slavic (9.2%, a difference of 0.22%), and Sierra Leonean (9.2%, a difference of 0.23%).
| Demographics | Rating | Rank | Unemployment Among Seniors over 75 years |
| Samoans | 5.7 /100 | #227 | Tragic 9.1% |
| Kenyans | 5.4 /100 | #228 | Tragic 9.1% |
| Hispanics or Latinos | 5.0 /100 | #229 | Tragic 9.1% |
| Northern Europeans | 4.9 /100 | #230 | Tragic 9.1% |
| Immigrants | Central America | 4.9 /100 | #231 | Tragic 9.1% |
| Africans | 4.9 /100 | #232 | Tragic 9.1% |
| Yugoslavians | 4.8 /100 | #233 | Tragic 9.1% |
| Vietnamese | 4.6 /100 | #234 | Tragic 9.1% |
| Panamanians | 4.0 /100 | #235 | Tragic 9.1% |
| Jordanians | 4.0 /100 | #236 | Tragic 9.1% |
| Houma | 3.9 /100 | #237 | Tragic 9.1% |
| Inupiat | 3.6 /100 | #238 | Tragic 9.1% |
| Mexicans | 3.5 /100 | #239 | Tragic 9.1% |
| Spanish | 3.3 /100 | #240 | Tragic 9.1% |
| Immigrants | Southern Europe | 2.8 /100 | #241 | Tragic 9.2% |
| Sierra Leoneans | 2.8 /100 | #242 | Tragic 9.2% |
| Slavs | 2.8 /100 | #243 | Tragic 9.2% |
| Immigrants | Germany | 2.7 /100 | #244 | Tragic 9.2% |
| Immigrants | Canada | 2.6 /100 | #245 | Tragic 9.2% |
| Immigrants | North America | 2.4 /100 | #246 | Tragic 9.2% |
| Sub-Saharan Africans | 2.3 /100 | #247 | Tragic 9.2% |