Jordanian vs Immigrants from Yemen Unemployment Among Ages 25 to 29 years
COMPARE
Jordanian
Immigrants from Yemen
Unemployment Among Ages 25 to 29 years
Unemployment Among Ages 25 to 29 years Comparison
Jordanians
Immigrants from Yemen
6.1%
UNEMPLOYMENT AMONG AGES 25 TO 29 YEARS
99.3/ 100
METRIC RATING
42nd/ 347
METRIC RANK
8.0%
UNEMPLOYMENT AMONG AGES 25 TO 29 YEARS
0.0/ 100
METRIC RATING
303rd/ 347
METRIC RANK
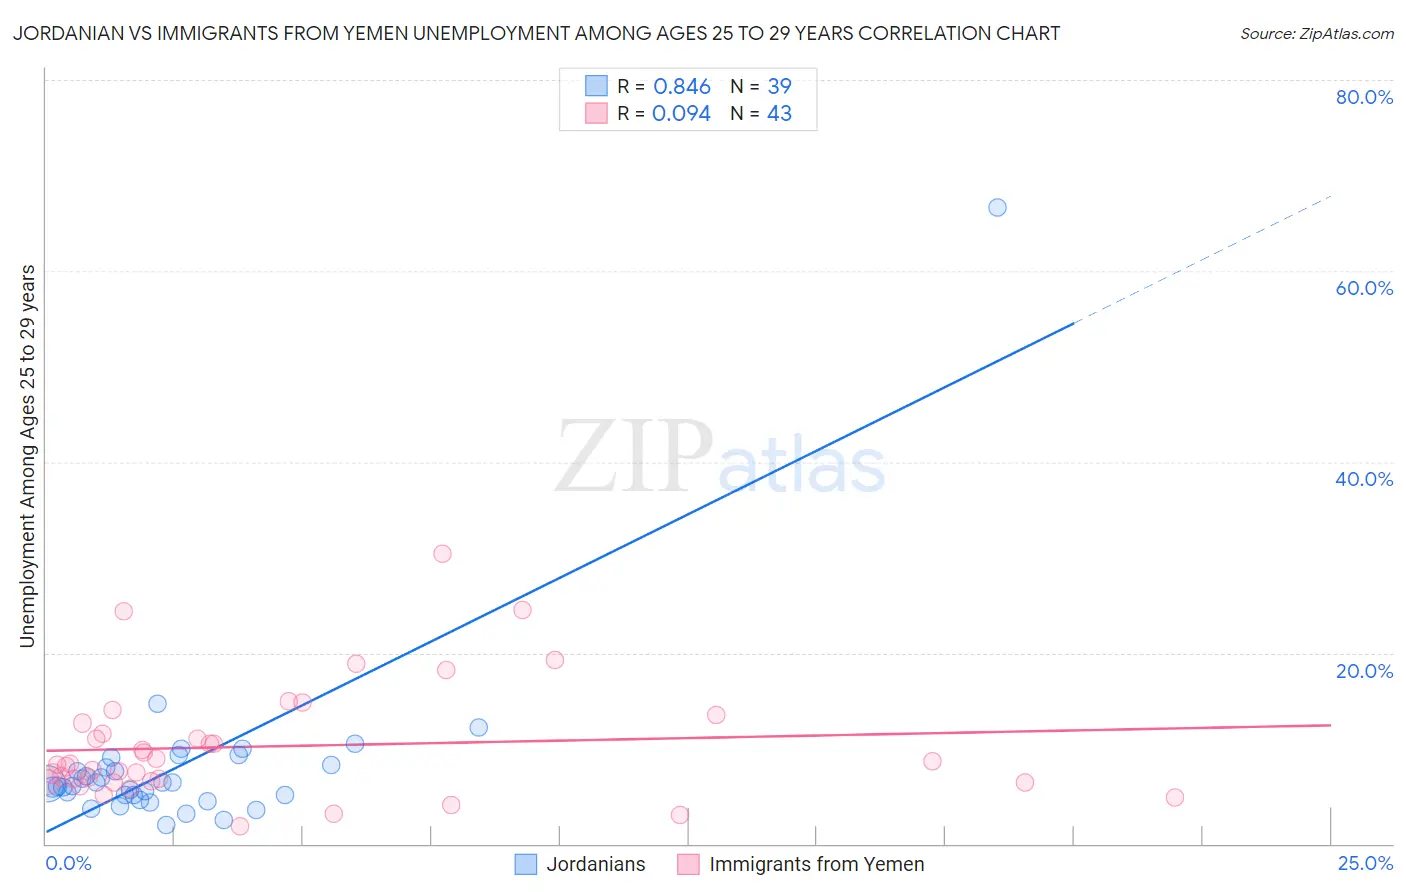
Jordanian vs Immigrants from Yemen Unemployment Among Ages 25 to 29 years Correlation Chart
The statistical analysis conducted on geographies consisting of 164,069,311 people shows a very strong positive correlation between the proportion of Jordanians and unemployment rate among population between the ages 25 and 29 in the United States with a correlation coefficient (R) of 0.846 and weighted average of 6.1%. Similarly, the statistical analysis conducted on geographies consisting of 81,785,794 people shows a slight positive correlation between the proportion of Immigrants from Yemen and unemployment rate among population between the ages 25 and 29 in the United States with a correlation coefficient (R) of 0.094 and weighted average of 8.0%, a difference of 30.0%.
Unemployment Among Ages 25 to 29 years Correlation Summary
| Measurement | Jordanian | Immigrants from Yemen |
| Minimum | 2.0% | 1.8% |
| Maximum | 66.7% | 30.4% |
| Range | 64.7% | 28.6% |
| Mean | 8.1% | 10.2% |
| Median | 6.2% | 8.3% |
| Interquartile 25% (IQ1) | 5.1% | 6.4% |
| Interquartile 75% (IQ3) | 8.2% | 12.6% |
| Interquartile Range (IQR) | 3.1% | 6.2% |
| Standard Deviation (Sample) | 10.0% | 6.1% |
| Standard Deviation (Population) | 9.8% | 6.0% |
Similar Demographics by Unemployment Among Ages 25 to 29 years
Demographics Similar to Jordanians by Unemployment Among Ages 25 to 29 years
In terms of unemployment among ages 25 to 29 years, the demographic groups most similar to Jordanians are Fijian (6.1%, a difference of 0.030%), Immigrants from Kenya (6.1%, a difference of 0.070%), Czech (6.2%, a difference of 0.13%), Mongolian (6.2%, a difference of 0.18%), and Indonesian (6.1%, a difference of 0.20%).
| Demographics | Rating | Rank | Unemployment Among Ages 25 to 29 years |
| Immigrants | Zimbabwe | 99.5 /100 | #35 | Exceptional 6.1% |
| Taiwanese | 99.5 /100 | #36 | Exceptional 6.1% |
| Immigrants | Serbia | 99.5 /100 | #37 | Exceptional 6.1% |
| Ethiopians | 99.4 /100 | #38 | Exceptional 6.1% |
| Indonesians | 99.3 /100 | #39 | Exceptional 6.1% |
| Immigrants | Kenya | 99.3 /100 | #40 | Exceptional 6.1% |
| Fijians | 99.3 /100 | #41 | Exceptional 6.1% |
| Jordanians | 99.3 /100 | #42 | Exceptional 6.1% |
| Czechs | 99.2 /100 | #43 | Exceptional 6.2% |
| Mongolians | 99.2 /100 | #44 | Exceptional 6.2% |
| Venezuelans | 99.1 /100 | #45 | Exceptional 6.2% |
| Immigrants | Lithuania | 99.0 /100 | #46 | Exceptional 6.2% |
| Latvians | 99.0 /100 | #47 | Exceptional 6.2% |
| Immigrants | Australia | 99.0 /100 | #48 | Exceptional 6.2% |
| German Russians | 99.0 /100 | #49 | Exceptional 6.2% |
Demographics Similar to Immigrants from Yemen by Unemployment Among Ages 25 to 29 years
In terms of unemployment among ages 25 to 29 years, the demographic groups most similar to Immigrants from Yemen are Cajun (8.0%, a difference of 0.22%), Tsimshian (8.0%, a difference of 0.48%), Haitian (8.0%, a difference of 0.56%), Immigrants from Barbados (8.0%, a difference of 0.72%), and Jamaican (7.9%, a difference of 0.94%).
| Demographics | Rating | Rank | Unemployment Among Ages 25 to 29 years |
| Immigrants | West Indies | 0.0 /100 | #296 | Tragic 7.8% |
| Blackfeet | 0.0 /100 | #297 | Tragic 7.9% |
| Immigrants | Trinidad and Tobago | 0.0 /100 | #298 | Tragic 7.9% |
| Barbadians | 0.0 /100 | #299 | Tragic 7.9% |
| Central American Indians | 0.0 /100 | #300 | Tragic 7.9% |
| West Indians | 0.0 /100 | #301 | Tragic 7.9% |
| Jamaicans | 0.0 /100 | #302 | Tragic 7.9% |
| Immigrants | Yemen | 0.0 /100 | #303 | Tragic 8.0% |
| Cajuns | 0.0 /100 | #304 | Tragic 8.0% |
| Tsimshian | 0.0 /100 | #305 | Tragic 8.0% |
| Haitians | 0.0 /100 | #306 | Tragic 8.0% |
| Immigrants | Barbados | 0.0 /100 | #307 | Tragic 8.0% |
| Immigrants | Jamaica | 0.0 /100 | #308 | Tragic 8.1% |
| Immigrants | Haiti | 0.0 /100 | #309 | Tragic 8.1% |
| U.S. Virgin Islanders | 0.0 /100 | #310 | Tragic 8.1% |